Jan 18, 2018
in Regime Change
An index can change rather importantly over time. Some segments go through sustained secular performance and become increasingly important on a secular basis. This has happened with the internet relative to much older industries. Sometimes it can be a bubble but for every time someone calls something irrational, there are many cases where something secular is happening.
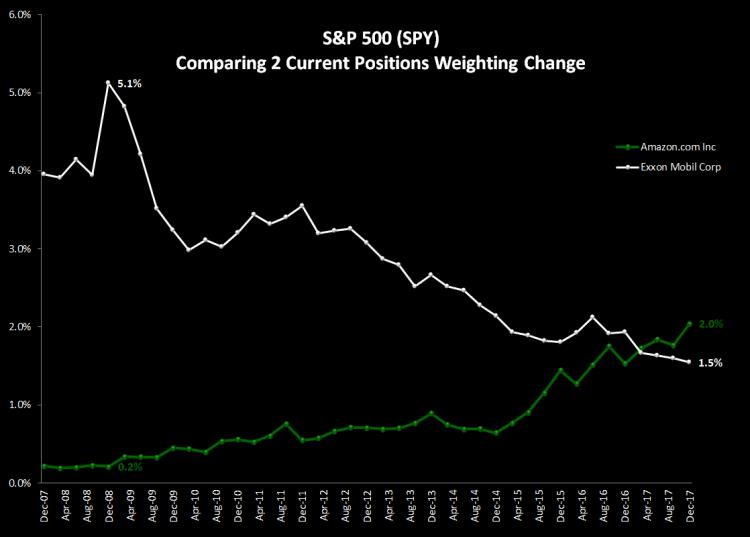
Below is a chart plotting how much more important Amazon.com is to the performance of the S&P 500 than it used to be. This has come at the expense of names like Exxon.
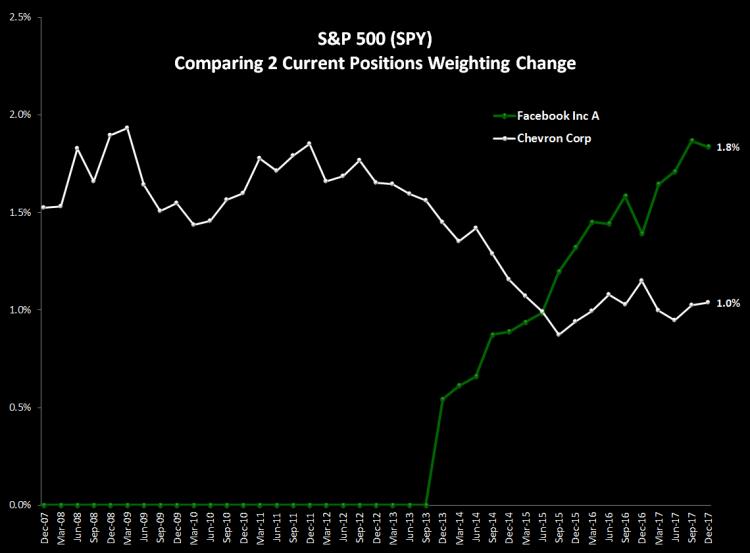
Another example is Facebook vs Chevron:
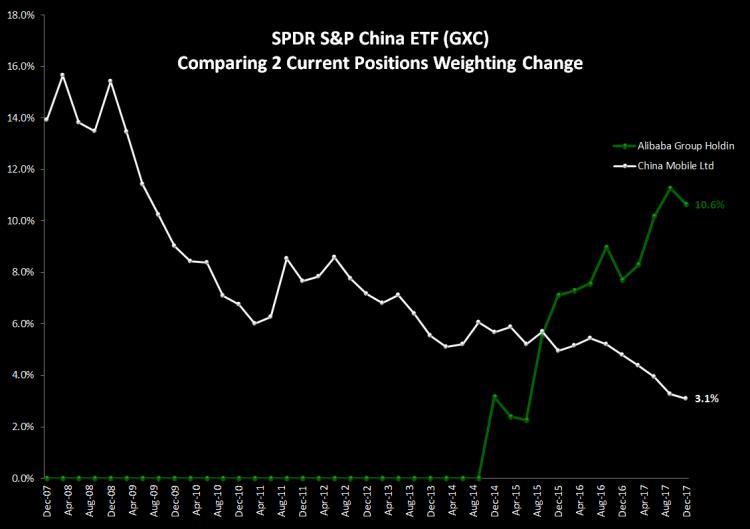
To look at a different part of the world, think about how important China Mobile used to be vs where it is now and how Alibaba Group was 0% and now its the 2nd largest holding in the S&P China Index.
Think about what this does to fundamental ratios like P/E's and dividend yields on the index aggregates. Exxon pays a large dividend -- AMZN and FB don't pay anything in dividends. Exxons P/E in 2007 was under 13x while the AMZN P/E has averaged well into the triple digits over the past 10 years.
This is loosely related to 'Regime Change' -- the fundamentals of backtesting are that you should think about RECENT DATA and weight it more heavily than old data. Same concept. What the P/E was 10 years ago isn't very important And what it was 30 years ago is less important than that. We do NOT mean to imply 'this time is different'. We are simply saying weight more recent times more highly than you do data from 100 years ago.
See also: Regime Change Backtesting
Jan 11, 2018
in Relative Strength, Video
A short video using the Advanced RS Pro backtest to look at how you can model the effect of Advisor-level fees over long periods of time.
to expand, click the '4 expanding arrows' icon in the bottom right corner of the video screen
Jan 07, 2018
in Drawdown
Study many different sub-periods for many different markets. It helps you understand scenarios, it helps you understand strengths and weaknesses of various techniques in backtesting.
Learn how to put the odds in your favor. If you study many different time periods across many types of markets, you will gain understanding of a strategy that is fragile vs a strategy that is more durable. You will have ideas that cannot be supported and you realize their weaknesses. Running bad backtests and learning from that is part of the process.
Below is one look at the 2000-2003 bear market. We suggest you look at that time period and many other time periods using many different types of funds. QQQ's downturn was especially bad due to the extended run-up in the prior years (QQQ index existed in prior years but the ETF product QQQ of course did not exist prior to the middle of 1999).
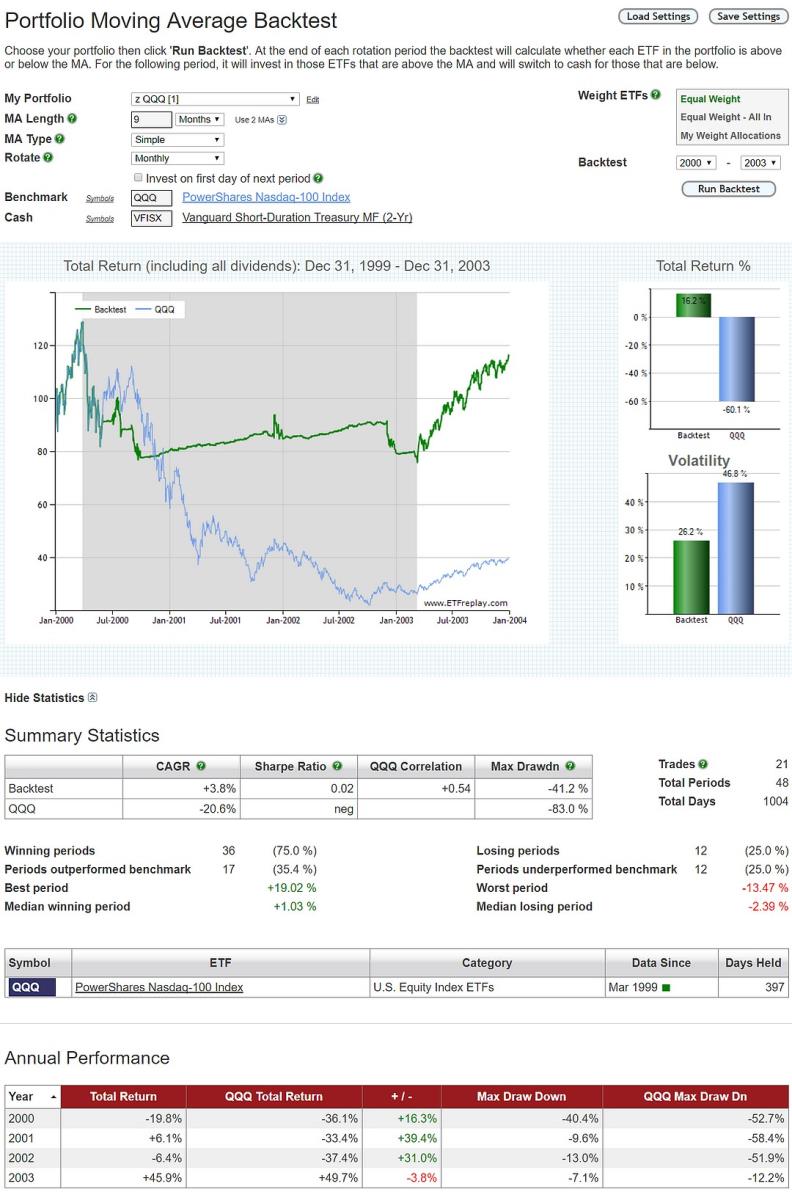
**A pro subscription allows you to backtest to 12/31/99 using daily total return data.
Dec 05, 2017
in Relative Strength, Video
A short video using the Advanced RS Pro backtest to look at how mixing strategies together performed during the 2000-2002 and 2008 bear markets..
to expand, click the '4 expanding arrows' icon in the bottom right corner of the video screen
Dec 04, 2017
We have just introduced a new subscription package for investing professionals.
Based on feedback and requests the we've received from advisors and portfolio managers, the new pro subscription adds the following functionality to the regular subscription.:
- All Moving Average, Channel, Ratio and Relative Strength portfolio strategies can be backtested from Dec 31, 1999
- Buy Top limit on all Relative Strength backtests raised to 20
- Number of favorite backtest settings to Save / Load increased to 20 per backtest
- Number of Dashboards increased to 20
- Advanced Relative Strength Pro backtest: test investing the strongest ETFs from up to 4 separate portfolios
- Core-Regime Relative Strength & Core-Regime Portfolios backtests
- Annual fee deduction option on Core-Satellite, Core-Regime RS and Adv RS Pro backtests
- MA Filter on Core-Satellite & Adv RS Pro can be Daily or Monthly MA
Subscribers that would like to upgrade to this new package can do so by going to My Account > Subscription Settings > Upgrade to Pro