Dec 14, 2020
in Screener, Sequential RS
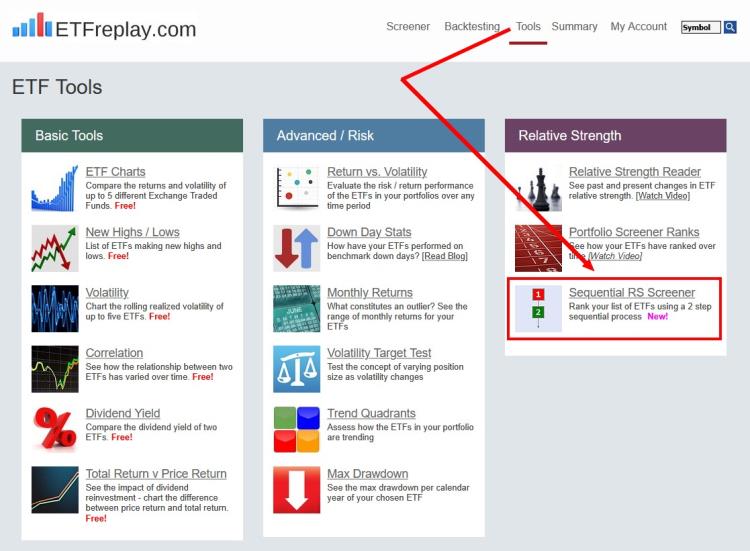
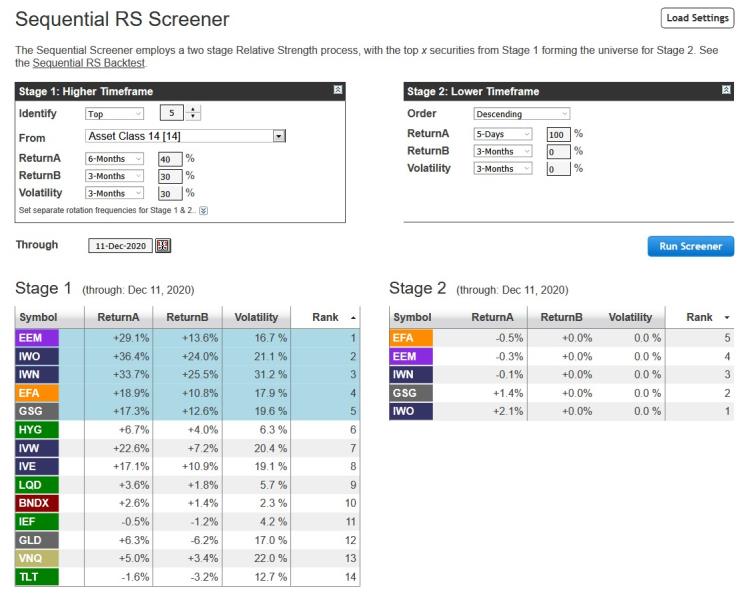
We have added a new tool for subscribers, the Sequential Screener, to compliment the Sequential Relative Strength backtest.
Sequential Relative Strength seeks to identify short-term weakness within a strong longer-term up trend by employing a two stage process. The Sequential Screener displays the rankings and composition of both the first and second stages on any trading date. The side-by-side layout makes it much easier to assess the current situation than the regular screener and can be helpful in anticipating changes in the run up to a rotation.
Nov 05, 2020
in Sequential RS, Sectors
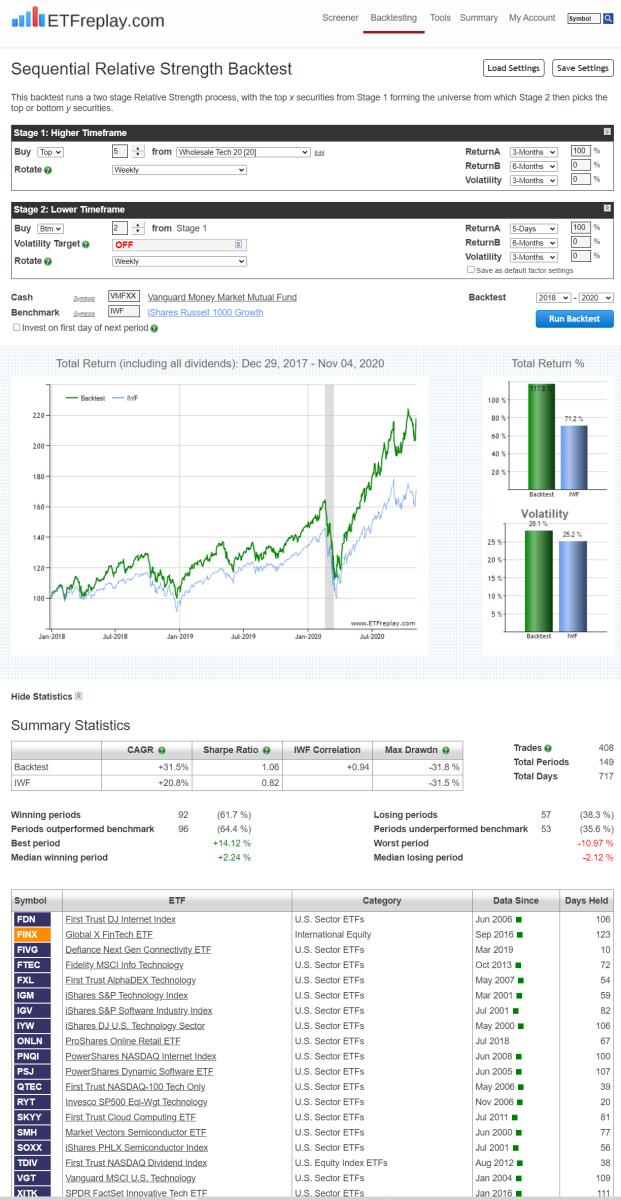
Sequential Relative Strength Is Powerful. Rather than always have the same list to go through, it automatically ranks a list and then only uses that sublist to choose from in a 2nd ranking... Keep in mind that over past few years you have still 'lost' money nearly 40% of the time -- so don't think that this is super easy to actually execute. It never seems like that... But keep working at finding good lists and making good entries and over time you will outperform and if you outperform an index that does well, you can do really well.
Oct 14, 2020
in Regime Change
This model is simple yet addresses an important issue for those that want to compete against a benchmark.
In order to compete against a specific benchmark, it makes sense to understand that benchmark. If you totally ignore it, you can do great but at times you will probably get frustrated because your strategy is totally out of sync.
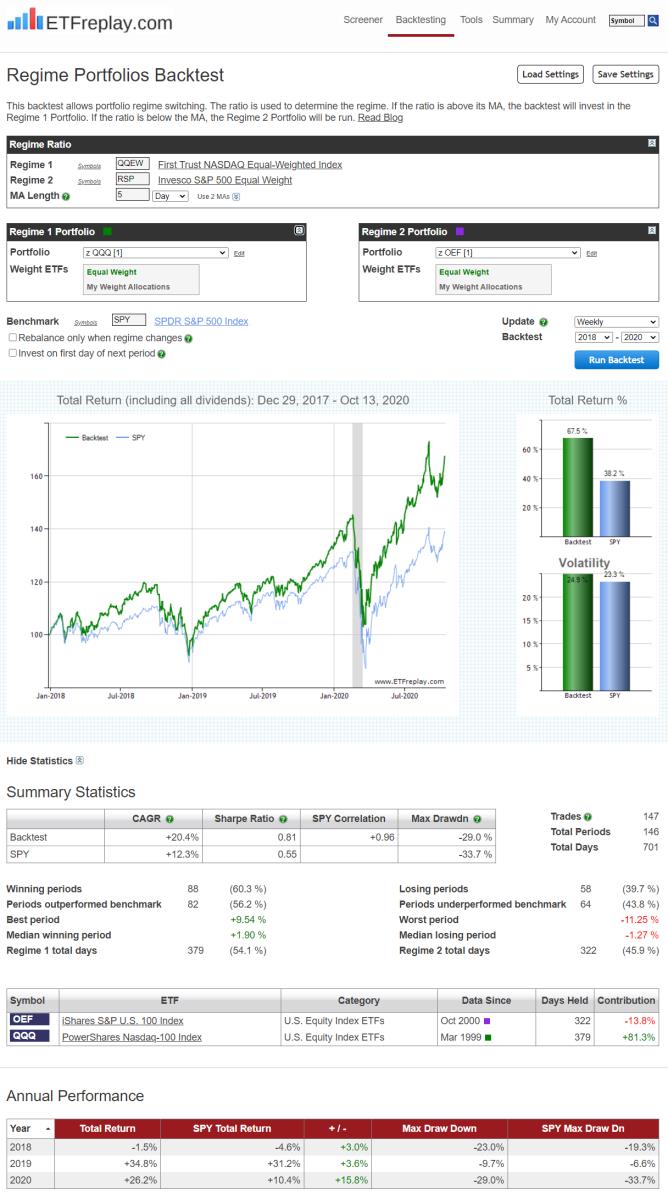
So take the example of a logical model of S&P Equal Weight vs NASDAQ Equal Weight. This is a pretty good indicator but at the same time, the S&P Equal Weight is wildly different portfolio than the weighted S&P because of the fact that market weight S&P is strongly skewed to the big, very profitable money-making S&P names (AAPL, AMZN, MSFT etc).
This backtest addresses that by using our Regime model. It still uses S&P EW vs NASDAQ EW as its indicator -- but then when it comes to actually buying and selling, it uses market cap weighted QQQ and market cap weighted OEF (S&P 100).
Take a look;
Aug 28, 2020
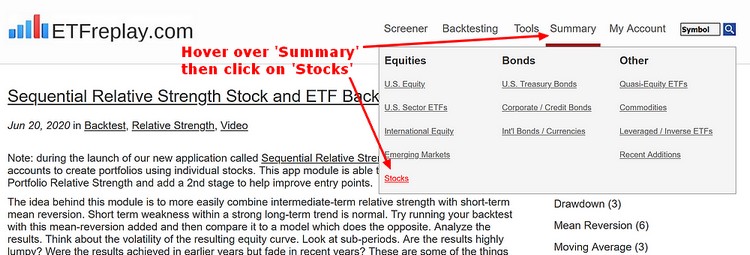
Q. "I have seen a few examples using ETFreplay to backtest stocks. This is something I would like to do but I don't see where this can be done on the website. Can you help?"
A. To see the list of available stocks hover over 'Summary' in the main menu, under 'U.S. Equity', click on 'Stocks'. The list is prmarily made up of the main holdings of the large ETFs, which are obviously our focus. There are also a few other interesting names and a small number of ADRs. These stocks can be added to portfolios, just like ETFs and mutual funds, and can be used with all backtesting modules and tools.
Jun 20, 2020
in Backtest, Video, Sequential RS
Note: during the launch of our new application called Sequential Relative Strength, we are allowing all accounts to create portfolios using individual stocks. This app module is able to expand on the core Portfolio Relative Strength and add a 2nd stage to help improve entry points.
The idea behind this module is to more easily combine intermediate-term relative strength with short-term mean reversion. Short term weakness within a strong long-term trend is normal. Try running your backtest with this mean-reversion added and then compare it to a model which does the opposite. Analyze the results. Think about the volatility of the resulting equity curve. Look at sub-periods. Are the results highly lumpy? Were the results achieved in earlier years but fade in recent years? These are some of the things ETFreplay was created to do -- not just look at the return of a strategy -- but to decompose it and analyze it to try to find something that is more robust. #STUDY
to expand video on screen, click the '4 expanding arrows' icon in the bottom right corner of the video screen. Use the settings icon to change to 1080 quality if it seems at all blurry