Dec 02, 2010
in Drawdown, Volatility
Volatility is a tough topic to get your hands around. But one key idea is to think in terms of drawdowns -- in general, the higher the volatility the higher the drawdown. What does this mean? It doesn't mean that volatility is just bad --- it means that with funds like the Russia Fund (RSX) or Brazil (EWZ) or Financial stocks (XLF), your TIMING is more important than with something like a consumer staples ETF (XLP) or an investment grade bond fund (CIU). Since we've posted this many times this year, it's time to take a look at some actual hard data through the first 11 months of 2010.
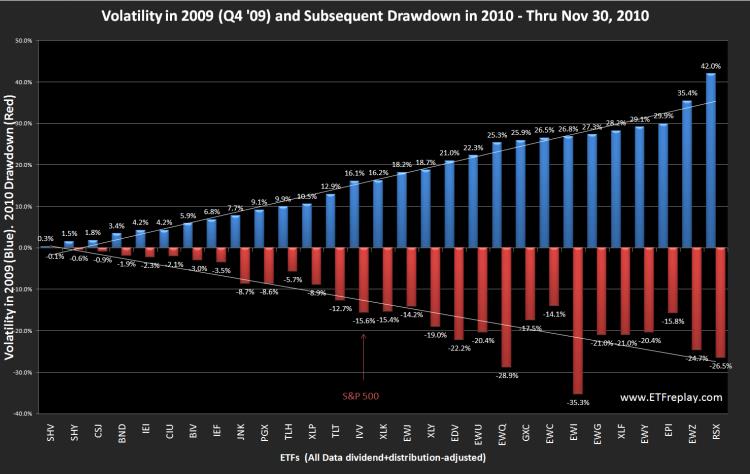
The chart below compares the known volatility exiting 2009 with the subsequent drawdown in 2010. We think this shows the basic idea pretty well. Its certainly not going to be exact --- but in general, it makes sense. So we can think about this from a higher level to help us. If our portfolio were 100% long Brazil (EWZ) all year, then the portfolio value would have moved down -24.7% off its high at one point. You didn't 'lose' -24.7% vs your starting cost --- but you did lose a big % off the high. A goal in portfolio management is to smooth out the ride a bit.
Note here that this is just one 11-month period of data. The concept is solid -- but the future will be different. The S&P 500 had a -15.6% drawdown during this particular period. Less volatile ETFs all had lower drawdowns. A few on this list that had significantly higher volatilities had lower drawdowns --- but not by much. This is for concept and its relative. If the S&P 500 has a larger drawdown next year, then expect these numbers to all be bigger when we do this again next year.
Apr 22, 2010
in Drawdown, Volatility
Lately I have read in a few places that "investors too often equate risk with volatility." The people who say these kinds of things rarely go on to present an argument based in statistical fact. This blog post is not to say anything is absolute --- but I will show some simple recent data that hardly refutes the statement put forth on the first page of Chapter 3 in ‘the bible’ of quantitative finance ‘Active Portfolio Management’ (Grinold & Kahn, 1999): – it could not be much clearer: “Risk is the standard deviation of return.”
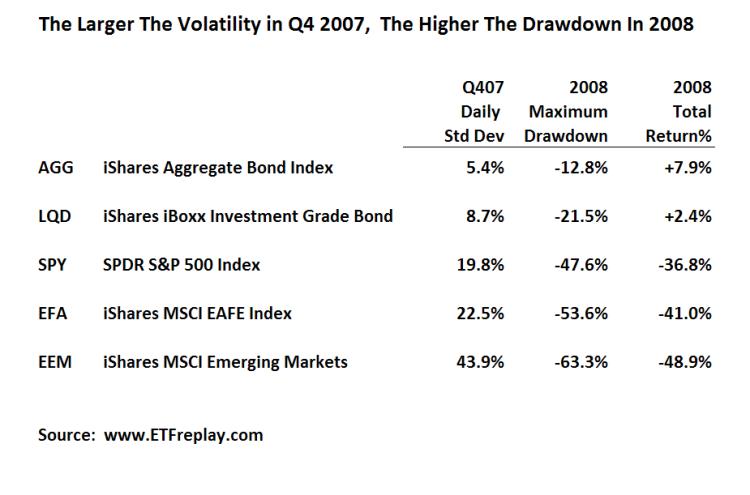
Below is data from the past bear market for 5 of the largest ETF’s in the world. I have chosen to use the standard deviation of the period PRIOR to 2008, Q4 2007. I then show the subsequent drawdown in 2008. Note how in each case of higher standard deviation, the drawdown was larger in the NEXT period.
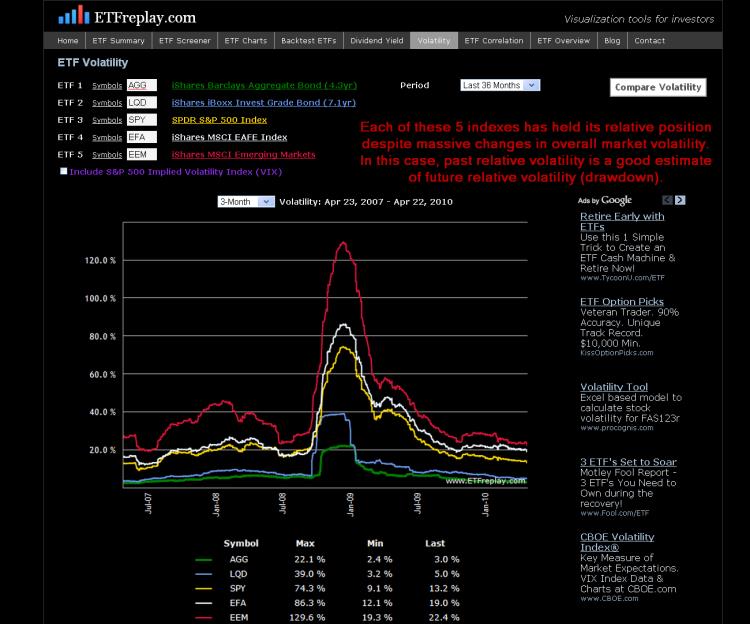
While the above is just a sample --- I can show this over many, many more ETF's. Thinking about your portfolio from the viewpoint of standard deviation can help you understand at least in some small way about how your portfolio might drawdown relative to some common benchmarks. This chart shows volatilities across these same 5 ETF's over time. Note that each ETF has held its relative position for the past 3 years -- zero change. While you cannot know with precision what the future holds -- you can to some extent understand your relative drawdown given S&P volatility of XX.