The Higher The Volatility, The Deeper The Drawdowns
Apr 22, 2010
in Drawdown, Volatility
Lately I have read in a few places that "investors too often equate risk with volatility." The people who say these kinds of things rarely go on to present an argument based in statistical fact. This blog post is not to say anything is absolute --- but I will show some simple recent data that hardly refutes the statement put forth on the first page of Chapter 3 in ‘the bible’ of quantitative finance ‘Active Portfolio Management’ (Grinold & Kahn, 1999): – it could not be much clearer: “Risk is the standard deviation of return.”
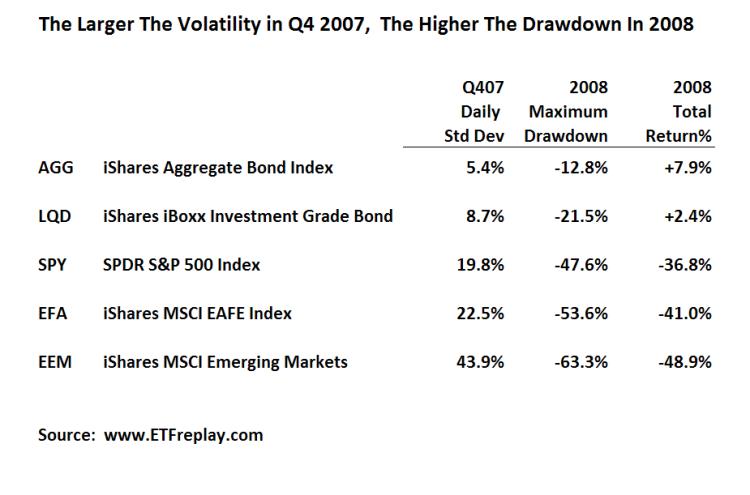
Below is data from the past bear market for 5 of the largest ETF’s in the world. I have chosen to use the standard deviation of the period PRIOR to 2008, Q4 2007. I then show the subsequent drawdown in 2008. Note how in each case of higher standard deviation, the drawdown was larger in the NEXT period.
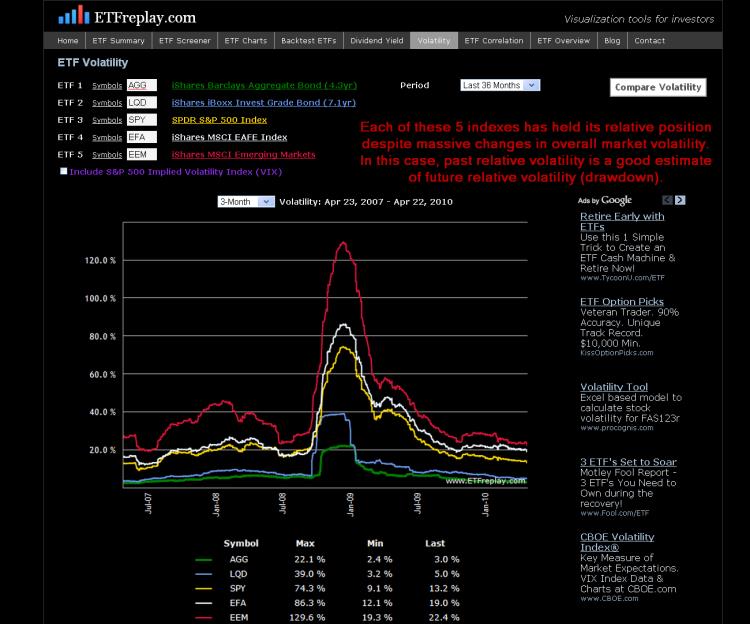
While the above is just a sample --- I can show this over many, many more ETF's. Thinking about your portfolio from the viewpoint of standard deviation can help you understand at least in some small way about how your portfolio might drawdown relative to some common benchmarks. This chart shows volatilities across these same 5 ETF's over time. Note that each ETF has held its relative position for the past 3 years -- zero change. While you cannot know with precision what the future holds -- you can to some extent understand your relative drawdown given S&P volatility of XX.
Follow ETFreplay on
