Category: Relative Strength
Jan 11, 2011
in Relative Strength, Moving Average
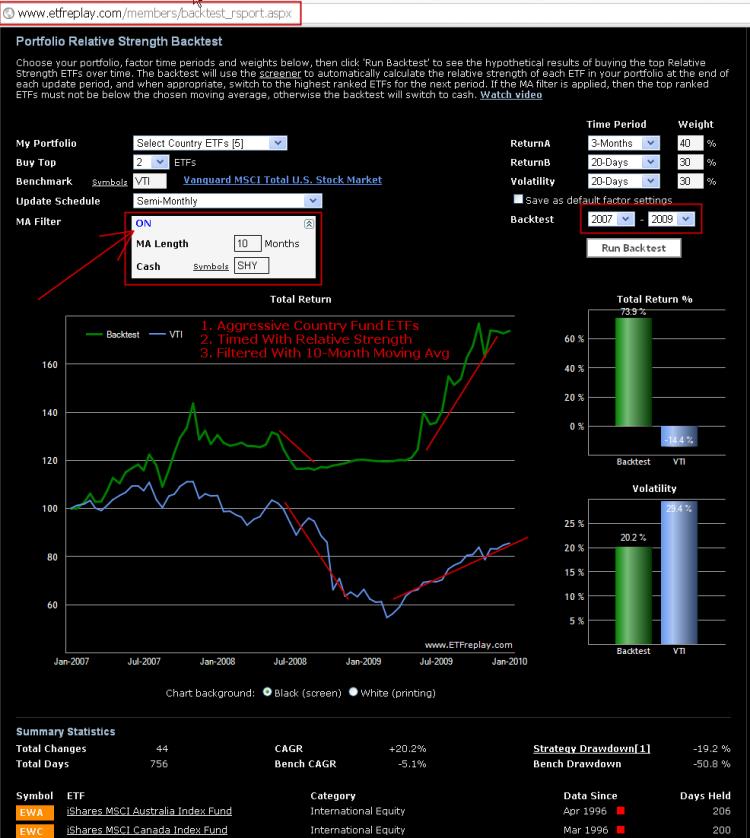
We have added an optional moving average (MA) filter feature to the RS backtest app. With the recently expanded date start and stop functionality, the applications continue to get more versatile.
Combining a long-term moving average within the construct of relative strength has been highly requested and we wanted to discuss one idea when considering whether to use it (note that you can just leave it set to ‘off’ as well).
If you build a relative strength list of say 10 ETFs and you are choosing the top 2, you could protect your portfolio by including 2 bond funds. You don’t need a moving average filter because the bond funds will naturally be the ones with the relative strength when equity markets are dropping. This method actually can get more interesting because you can make better use of more type of ETFs. Rather than just use cash-like bond funds, you might want to extend the potential holdings to an intermediate bond fund like IEF (7-8 year duration) or others. You don't HAVE to restrict yourself to just stocks and cash.
Another way to test is by using a moving average. If you do it this way, then you will inherently be out of ETFs as they go into extended downtrends. You don’t have to proportionally keep X number of bond funds in your list if you do it this way.
But a lot of indexes can go above or below a long-term moving average and still not really be a source of market leadership and enhance your return. Moreover, you may save a lot of money between the time ETFs lose relative strength and the time they actually cross below the moving average. For these reasons, we believe adding relative strength to a MA strategy will generally be more robust. Adding MA to a RS strategy is optional -- and you may find works better or worse than your existing method. Continuous testing leads to better decisions.
Dec 08, 2010
in Relative Strength
Some links to published research on various forms of relative strength concepts. The concept is over a century old. (I am not aware of any studies that involve ETFs directly -- let us know if you know of one).
Abstract from paper #1 above 'Time Series Momentum':
"We document significant "time series momentum" in equity index, currency, commodity, and bond futures for each of the 58 liquid instruments we consider. We find persistence in returns for 1 to 12 months that partially reverses over longer horizons, consistent with sentiment theories of initial under-reaction and delayed over-reaction. A diversified portfolio of time series momentum strategies across all asset classes delivers substantial abnormal returns with little exposure to standard asset pricing factors, and performs best during extreme markets. We show that the returns to time series momentum are closely linked to the trading activities of speculators and hedgers, where speculators appear to profit from it at the expense of hedgers."
Dec 02, 2010
in Relative Strength
Charles Schwab recently published some summary statistics on their accounts. They said that while 90% of accounts own individual stocks – just 15% of accounts hold ETFs. So while many people may have been using ETFs for many years now, using Schwab as a proxy, about 85% of people still need some introduction to ETFs.
There are 3 basics schools of thought on active management in general:
- Those that think it’s impossible
- Those that think it’s easy
- Those that think it’s a challenge -- but rewarding
For those that think passive management is the way to go, your job is still not over. You will still need to figure out an asset allocation. “Just buy index funds” actually doesn’t get you far --- there are over 1000 ETFs that follow various indexes and there is no single answer to what exactly constitutes a passive strategy. I can’t imagine there exists a professionally trained investment advisor who advises putting 100% of money into a S&P 500 index -- but I guess never say never. So absent that, there are still allocation decisions to be made about stocks vs bonds -- as well as the mix of international stocks and how much to include in alternatives like REITs & Precious Metals. These are all classic passive indexing discussion points.
For those that think like #2 above – that active management is easy, this crowd is likely just plain dangerous. They simply ‘don’t know what they don’t know.’
The third group acknowledges the challenge and comes at the issue with some humility. We sit firmly in the 3rd camp. It takes some analysis and testing and hard work to do well in investing. You don’t need to just come up with ideas – you need an investment PROCESS. That is, some type of structured approach.
So let’s introduce the core-satellite approach. It’s excellent for its flexibility in balancing return & risk. Here is a visual that Blackrock has used for this:
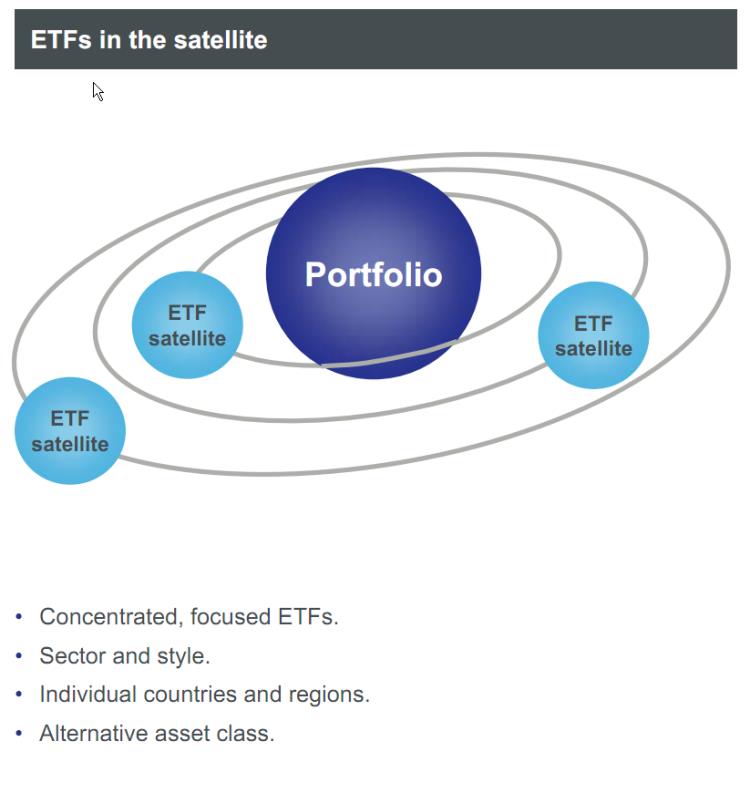
Source: Blackrock
What makes this framework really powerful is that you can pursue more aggressive strategies --- but still rein in the overall risk of a portfolio. You can stay within your specific risk tolerance but still buy/overweight some attractive (but perhaps more-volatile) segments. Or perhaps you are an advisor and your clients have different risk appetites. You can use your same ideas across these different accounts but just change the allocations between the conservative core and the more aggressive satellite strategies to more precisely target the appropriate risk-budget.
A typical investor thought might be --- I like the idea of investing in Emerging Asia – but how do I do it? How do I think about the risk involved in the short-run if and when some problem emanates out of South Korea or India or China?
So for a very basic start, let’s mix the core idea of completely passive-indexing with just 1 or 2 actual ideas. In this example, rather than invest in just the benchmark S&P 500, we will invest 80% in the S&P 500 and 10% in each of two other market segments --- Real Estate Investment Trusts and Gold.
Below is a look from our free Backtest Portfolio app to observe how this portfolio looks Year-To-Date (total return):
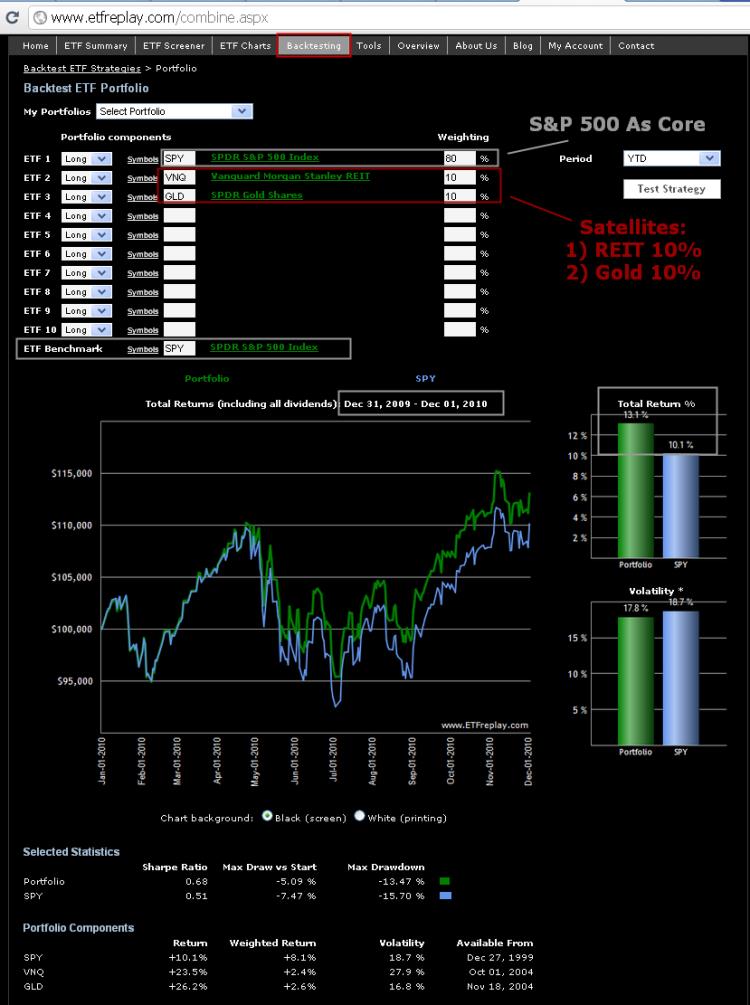
Note the 3 percentage point pick-up in performance this year for some pretty simple ‘tilts’. Importantly, note also that there has been some diversification benefit (reduction in volatility). Other than returns being better, the core-satellite portfolio went down less over the summer. So it went down less and yet has added 3%. Your tilts added significant value here. Not bad for a start. But we can do better.
If you are a registered user on the site – whether you registered 8 months ago or yesterday – you may have noticed you had 1 starter portfolio we created called ‘Sample Portfolio.’ Rather than use REIT’s and GLD as our satellite strategies, what if we instead used this sample portfolio top relative strength pick as 20% of the portfolio. Here is that example using our new Advanced RS Application (for subscribers)
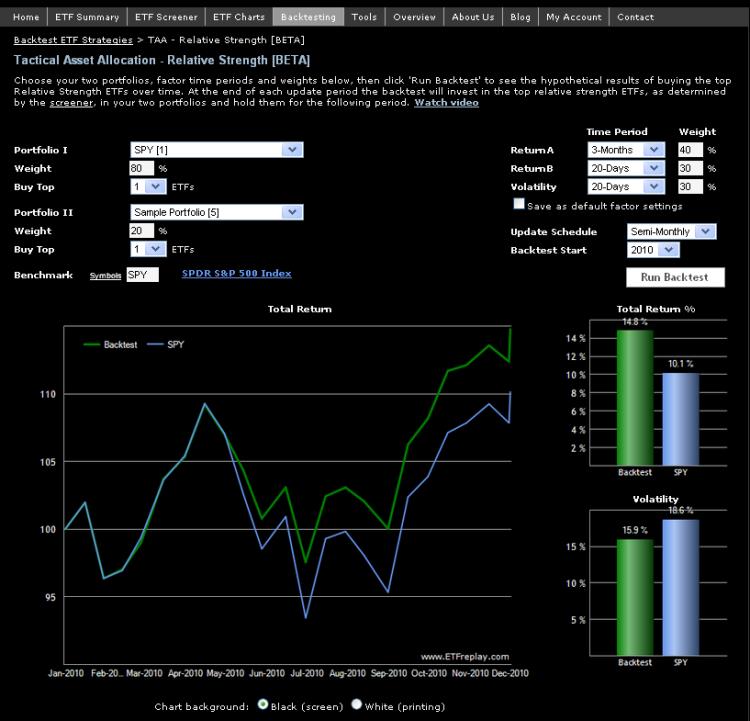
Notice that the result here is +14.8% return with even more diversification benefit (it went down even less during the summer correction). Remember, it is 80% S&P 500 in the first place so this is actually an excellent result. Standalone, this ‘sample portfolio’ that we created in the Spring time has had a banner year --- see for yourself within the portfolio backtest app.
As you will see when using the TAA application – and as we will discuss in upcoming blogs, you can change the percentage allocations from the core to the satellite and back to the core and see how it affects the overall results -- not just in returns but in ‘smoothing out the ride’ with lower volatility. This is the very essence of TAA.
All of this is just a start for those who are new to ETFs. We have many more options available in this core-satellite framework. A more conservative investor – perhaps older and less willing to take even average risk --- could start with a bond-only core portfolio and then add equities as satellite strategies. Or we could start with a more diversified core (say mixing REITS & Gold & Junk Bonds in the core) and then add country or sector funds in the satellite(s). These and other ideas will be future blog topics.
Nov 28, 2010
in Relative Strength
A typical buyside analyst looks at the world in terms of business fundamentals, earnings estimates, quality of management, competitive position, competitive advantage, return on invested capital, P/E multiples and so forth.
You will often hear analysts talk about P/E’s being low relative to growth rates or low vs 10-year bond yields or low vs a group of comparable companies or the overall market etc.
Is the price/earnings (P/E) multiple a good indicator for future performance? One interpretation of this fundamental valuation measure is rather than thinking in terms of the current valuation vs ‘fair value’ --- is simply to observe whether the valuation is expanding or contracting and decide if you believe this will continue.
If a P/E has just gone from 14x to 12x, its cheaper – but is that bullish? How do we know its not headed lower? We should probably test this and see if it works and then create some guidelines for portfolio strategy based on this. Wouldn’t that make sense rather than just blindly believing that a lower multiple is bullish?
Relative strength can actually be thought of as fundamental analysis if you wish to think about it like that. It would not be unusual for a fundamental analyst to say during a rally “the P/E multiple is still too low at 12x next years earnings” -- even though it’s up from a low of 9x and you bought the stock at 10x. But this is not any different than watching relative strength and buying at the same price and looking for further valuation expansion.
Good relative strength analysis captures when a market segment is experiencing valuation expansion. A low P/E is not actually bullish unless its low and then expands higher. This is the crucial aspect – not the absolute level of valuation.
Nov 21, 2010
in Relative Strength, Screener
We have received this question a number of times in email and so we wanted to clarify something.
R.S.I. (known as the Relative Strength Index) and the way we at ETFreplay.com discuss ‘Relative Strength’ are not the same thing. We wanted to briefly explain this.
R.S.I. is a technical analysis tool that involves only a single security -- it measures the average amount of up closes vs the average down closes over a given period of time. The most important distinction here is that R.S.I. only looks at the closing values of one security. There is nothing in the calculation of R.S.I. that involves anything but the historical prices of this SINGLE security.
The way ETFreplay uses relative strength has nothing to do with R.S.I. We use relative strength as a way to determine which among multiple market segments is relatively strong.
Many of you are probably familiar with Investors Business Daily. The paper has for a long period of time used a ‘RS Rank’ --- this is more like what we use. Note that IBD certainly did not invent the concept of relative strength -- but they built a database of securities and then ranked everything relative to each other. Institutional-oriented software programs do the same thing. A RS Rank of 90 in IBDs method means that a stock has outperformed 90% of the other securities in their database over a given period of time. High-end institutional software does something similar – except they proceed more mathematically by instead expressing the strength of the security as the distance from the average of a group --- and this is usually stated in terms of the # of standard deviations away from the mean (think z-score).
This is all similar to what we have done – except we do it with ETFs and then allow you to backtest it yourself rather than just saying ‘you should buy relative strength because it works.’ We also allow the user to define relative strength themselves – using easy browser controls like drop-down menus and text boxes. So for example you could simulate IBD’s method by using 12-month performance and ranking ETFs in a given universe like this:
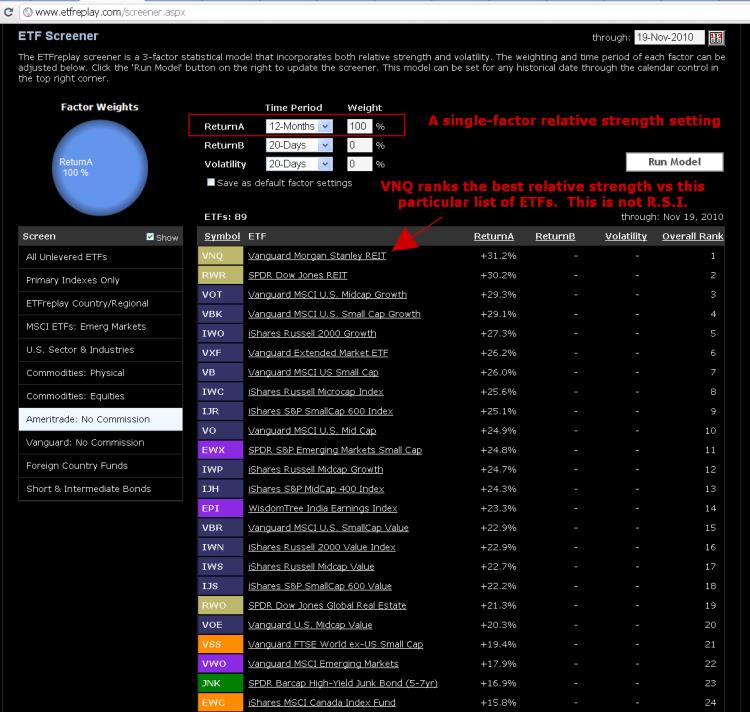
click image to view full size version
Then you could go the Portfolio Relative Strength backtest to see how 12-month relative strength has been holding up over the past 10+ years and see what kind of drawdowns its had.
This is all a research process – its just that we are performing research that comes in a very practical form. We aren’t researching stocks, we are researching strategies --- strategies based on baskets of stocks. Backtesting is not the only thing that matters --- but its pretty darn good information for you to factor into your decision-making process. Without some historical testing, you could easily go a lifetime of doing things that you thought worked – but actually don’t -- and never really did.
Go to the Screener
Not a subscriber? Subscribe