A Simple Example of Global ETF Relative Strength
Oct 20, 2010
in Relative Strength
We showed a few examples of some very basic relative strength techniques at a recent investor event.
This example was meant to show a relative strength strategy that easily could have been thought of as unbiased at any point in past 10 years -- or right now for that matter.
For simplicity, we have used the global regional ETFs and have simply covered the major parts of the 'developed world'. We know that emerging markets have been excellent performers over the past 7-8 years -- as have selected other assets like Gold -- but we have intentionally left these out. We wanted to show something that had some poor performing picks, a few good ones and therefore representative of someone who didn't pick ETFs particularly well but implemented a sound technique to stay with leaders and avoid large underperformers.
Importantly, we believe investors SHOULD decide first which ETFs they would like to be involved with and exclude those they have no interest in on a fundamental basis -- this is value-add to a basic, mechanical technique such as this.
So for this example we use the World Index as a starting point and seek to just 'cover' the developed regions:
Current Approximate Weightings in Global Indexes are:
| United States |
42.0% |
| Developed Europe |
25.0% |
| Japan |
7.0% |
| Developed Pacific [1] |
7.0% |
| Canada |
4.5% |
***Emerging Markets Excluded
[1] Developed Pacific is ~97% Australia/Hong Kong/Singapore and 3% 'other' (New Zealand etc..)
From an indexing perspective, Canada is always kind of the lonely child. Canada is generally not included within a broader regional ETF -- and is not generally lumped with the United States for a North American ETF. For conservatism here, I will exclude Canada and use the first 4 only. These are logical regions in our view. We get coverage of many different countries within this regional framework so this seems quite fair and hardly something that could not have been thought of many years ago -- or even today.
We will include the first 4 from above and SHY, a <2-year duration U.S. Treasury ETF which will act as a benchmark for positive returns. If no region of the world is beating 2-year maturity short-term fixed-income -- then SHY will by default be thought to be the highest Relative Strength ETF.
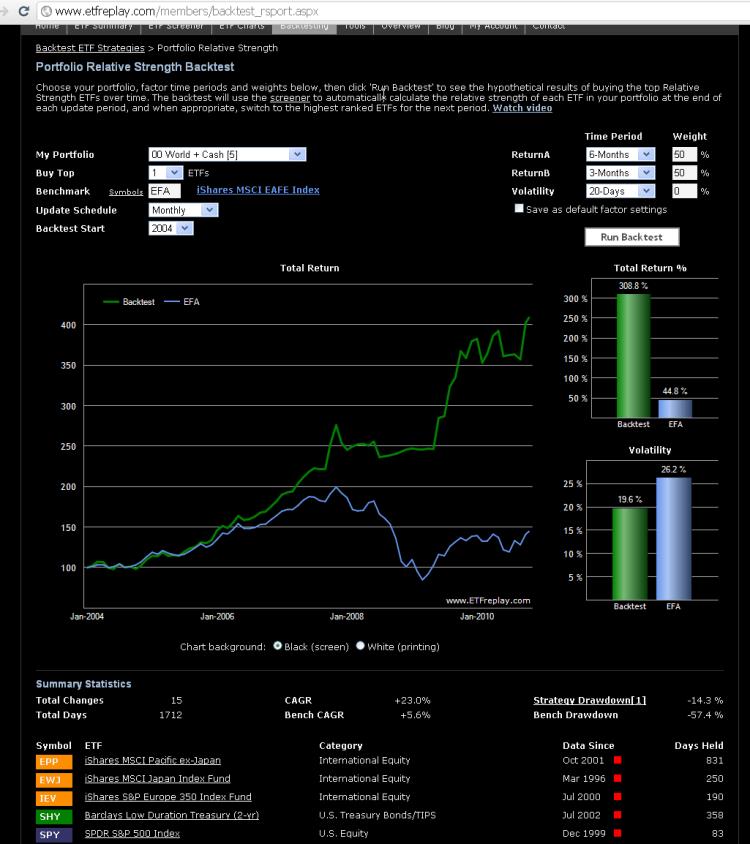
Here is the result using a 6-mo / 3-mo 2-factor relative strength model with monthly re-balancing.
Note all historical results are purely hypothetical and meant to show the mechanics of the backtesting application. This does not represent investment advice.
Symbol list here is: SPY, EWJ, IEV, EPP, SHY
Follow ETFreplay on
