Dashboard improvements
Sep 02, 2022
in Dashboards
We have added the following new options to dashboard window headers to make it easier and quicker to access related tools:
- C - click to open a new browser tab containing the Charts page that’s auto populated with both securities from the dashboard window
C appears above Ratio MA chart and TRD chart
- B - click to open a new browser tab with the relevant Backtest auto-populated with the securities / portfolio and parameters from the dashboard window
B appears above Ratio MA chart, MA chart, CHL chart, TRD chart and Ranks
- PS - click to open a new browser tab containing the Parameter Performance Summary that's auto-populated with the securities / portfolio and parameters from the dashboard window.
(note: Parameter Performance Summaries are available to annual subscribers, both regular and pro)
PS appears above Ratio MA chart, MA chart, CHL chart, TRD chart and Ranks.
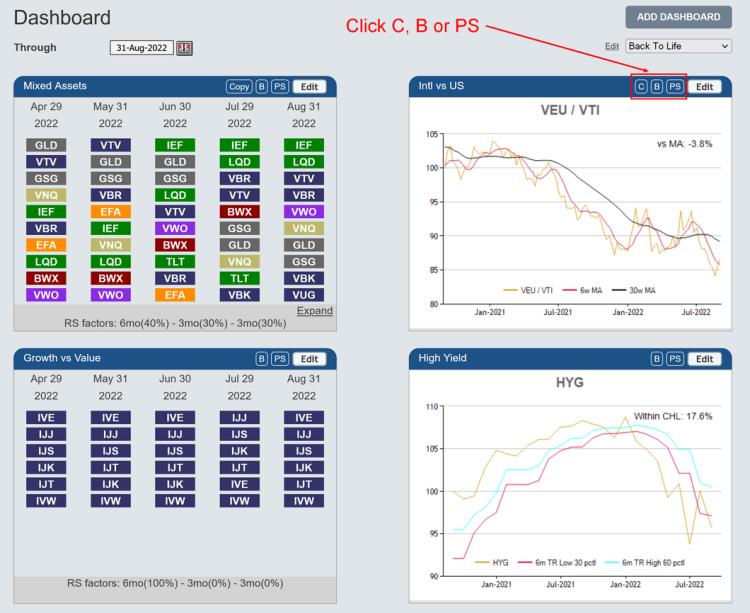
click image to view full size version
In addition, if all windows on a dashboard are TRD charts, a TRD Lookback drop-down-list now appears at the top of the page, beneath the ‘through’ date selector. This drop-down-list controls all the TRD charts on the dashboard, making it very easy to switch between lookback lengths.
By default it is set to 'Saved Value'; each of the TRD charts displays its own saved lookback length. If the drop-down-list is changed to 9-day, for example, then all the TRD charts on the dashboard will be recalculated and display a 9-day TRD. etc.
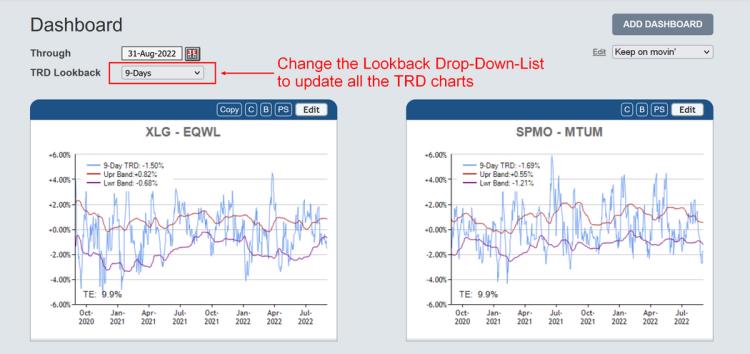
click image to view full size version
Follow ETFreplay on
