New Dashboard Chart
May 26, 2025
in Dashboards
We have added a new window option to the dashboard; Total Return Chart.
The new chart displays the total return value of 1 or 2 securities over the specified lookback period.
The dashboard example below has 4 charts that show the performance of EFA and SPY over 3, 6, 9 and 12-months.
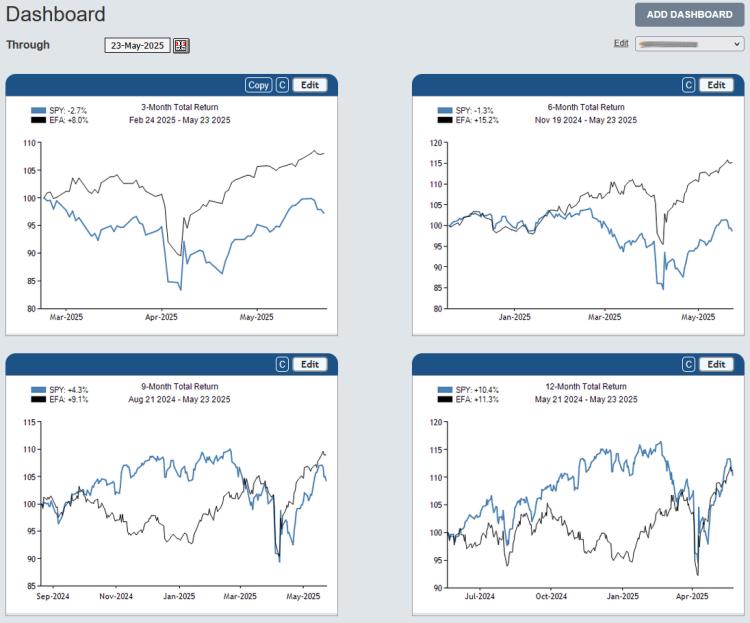
click image to view full size version
See: Introducing Dashboards: A Way To Help Organize Workflow In Research & ETF Portfolio Backtesting
Follow ETFreplay on
