Relative Strength vs R.S.I.
Nov 21, 2010
in Relative Strength, Screener
We have received this question a number of times in email and so we wanted to clarify something.
R.S.I. (known as the Relative Strength Index) and the way we at ETFreplay.com discuss ‘Relative Strength’ are not the same thing. We wanted to briefly explain this.
R.S.I. is a technical analysis tool that involves only a single security -- it measures the average amount of up closes vs the average down closes over a given period of time. The most important distinction here is that R.S.I. only looks at the closing values of one security. There is nothing in the calculation of R.S.I. that involves anything but the historical prices of this SINGLE security.
The way ETFreplay uses relative strength has nothing to do with R.S.I. We use relative strength as a way to determine which among multiple market segments is relatively strong.
Many of you are probably familiar with Investors Business Daily. The paper has for a long period of time used a ‘RS Rank’ --- this is more like what we use. Note that IBD certainly did not invent the concept of relative strength -- but they built a database of securities and then ranked everything relative to each other. Institutional-oriented software programs do the same thing. A RS Rank of 90 in IBDs method means that a stock has outperformed 90% of the other securities in their database over a given period of time. High-end institutional software does something similar – except they proceed more mathematically by instead expressing the strength of the security as the distance from the average of a group --- and this is usually stated in terms of the # of standard deviations away from the mean (think z-score).
This is all similar to what we have done – except we do it with ETFs and then allow you to backtest it yourself rather than just saying ‘you should buy relative strength because it works.’ We also allow the user to define relative strength themselves – using easy browser controls like drop-down menus and text boxes. So for example you could simulate IBD’s method by using 12-month performance and ranking ETFs in a given universe like this:
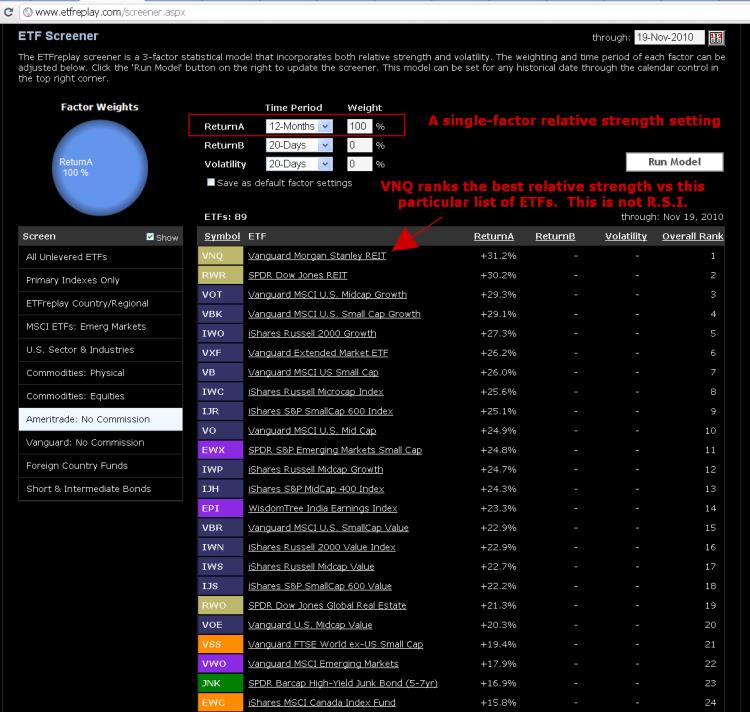
click image to view full size version
Then you could go the Portfolio Relative Strength backtest to see how 12-month relative strength has been holding up over the past 10+ years and see what kind of drawdowns its had.
This is all a research process – its just that we are performing research that comes in a very practical form. We aren’t researching stocks, we are researching strategies --- strategies based on baskets of stocks. Backtesting is not the only thing that matters --- but its pretty darn good information for you to factor into your decision-making process. Without some historical testing, you could easily go a lifetime of doing things that you thought worked – but actually don’t -- and never really did.
Go to the Screener
See also: Relative Strength: 3 Factor vs Composite
Not a subscriber? Subscribe
Follow ETFreplay on
