Category: Ratio
Mar 13, 2023
in Ratio
We have added a new composite version of the Ratio Moving Average backtest, which makes it possible to diversify across a range of MA lengths.
The Ratio MA backtest creates a ratio of the Total return value (not just price) of two securities; Risk On / Risk Off. The ratio will rise when the Risk On security outperforms the Risk Off security and fall when Risk-On underperforms.
The regular Ratio MA backtest invests in the Risk On security when the ratio is above its x-period moving average (i.e. the ratio is trending up) and switches to Risk Off when the ratio is below its MA.
The new Ratio MA Composite backtest reduces the risk of choosing a single MA length that, though it backtested well, turns out to perform poorly. For instance, rather than relying solely on a 6-month moving average, with the possibility that it underperforms in the future, the example below employs a range of moving average lengths from 3-month through 12-month with a step value of 1. This means that, each month, the backtest will compare the VUG / RSP ratio to its 3-month moving average, 4-month MA, 5-month, 6…11 and 12-month MA and invest 10% in the chosen security from each.
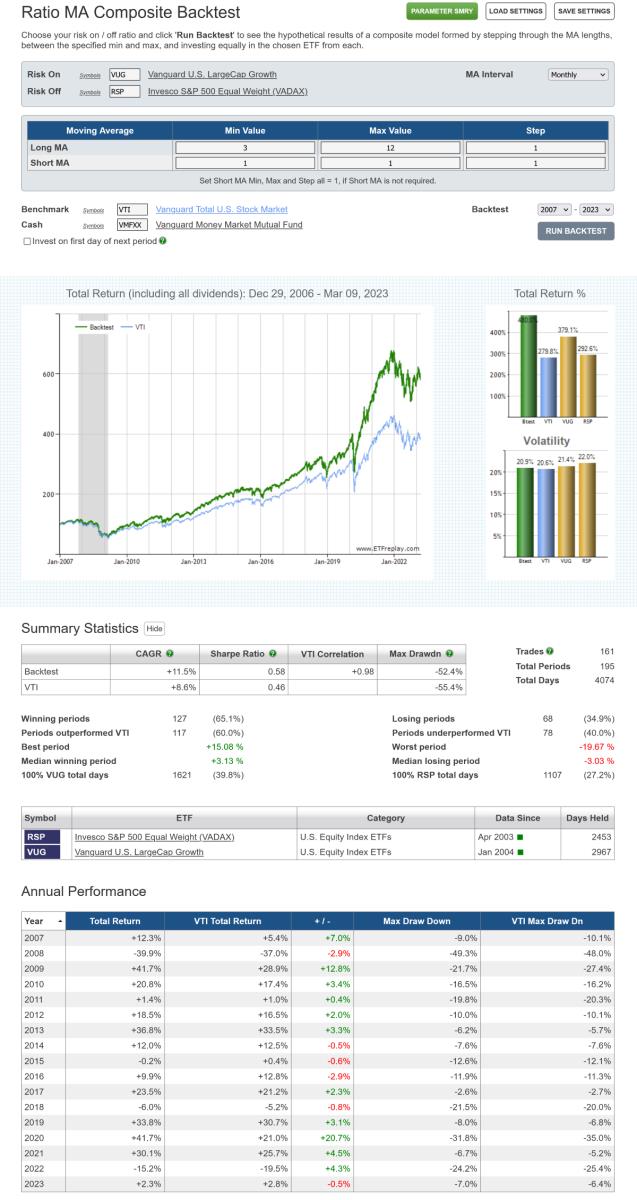
click image to view full size version
The step value can be changed to strike the desired balance between MA length diversification and real-world practicality. For instance, if the step value was increased to 2 in the above example, then the backtest would compare the VUG / RSP ratio to its 3-month, 5-month, 7, 9 and 11-month moving averages and invest 20% in the ETF resulting from each of those.
The composite can also be employed as a blended regime indicator using the weights displayed in the Backtest Trade History table.
The new Ratio MA Composite and the RS Composite backtest, which we introduced at the end of January, are available to all (regular and pro) annual subscribers.
notes:
- To see how each of the MA lengths performed individually, rather than as a composite, use the Ratio MA Parameter Performance Summary. The Parameter Performance Summary results can then be used to narrow the range between the min and max MA lengths.
-
If, rather than using a ratio, you want a backtest employing a range of moving average lengths on a single ETF, then you can use XZERO as the Risk Off security. XZERO is simply a zero return index (i.e. it's a constant), so an MA of the ratio ABC / XZERO is the same as a moving average of ABC itself. See Using SPY as a regime switch.
Aug 23, 2022
in Regime Change, Ratio
A question that we receive with some regularity is "can I run a backtest that changes strategy based on whether SPY is above or below its 200-day Moving Average?"
The answer is yes. We have a group of backtests that switch between strategies depending on the prevailing regime. These regime backtests build up on the logic of the Ratio MA backtest and come in 2 varieties:
With these two backtests, when the ratio is above its MA the backtest runs the Regime 1 portfolio / RS strategy (i.e. Risk On). Conversely, when the ratio is below its MA, the Regime 2 (Risk Off) portfolio is chosen.
If, rather than using a ratio, you want to switch strategy based on whether or not SPY alone is above / below its 200-day MA, then you can use XZERO as the Regime 2 security.
XZERO is simply a zero return index (i.e. it's a constant), so an MA of the ratio SPY / XZERO is the same as a moving average of SPY itself (see the Parameter Summary comparison at the bottom of this post).
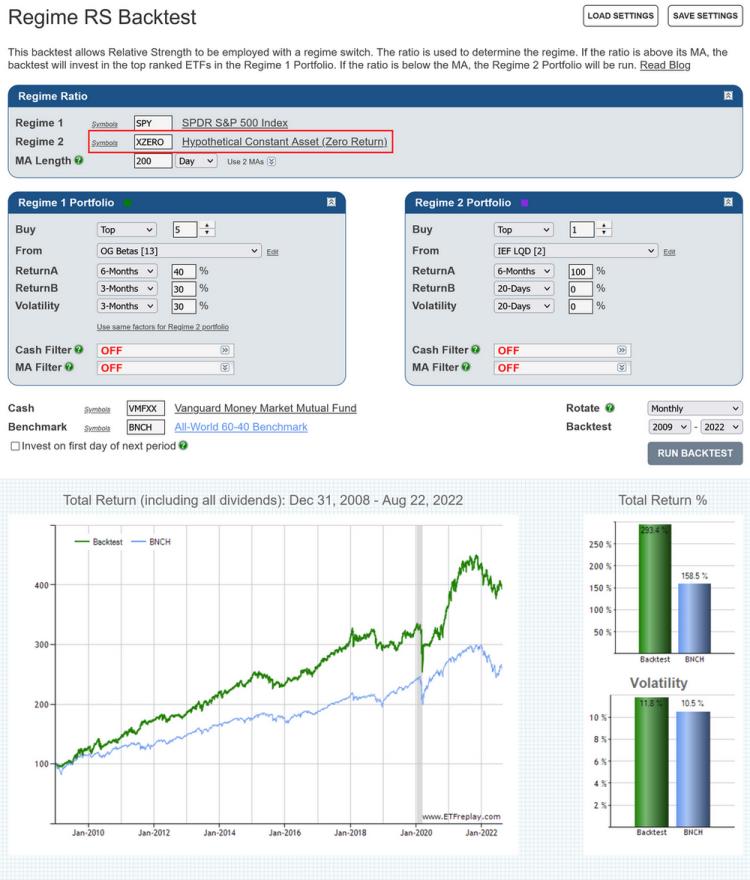
Regime RS backtest that uses the SPY 200-day MA to determine the regime
Note: Moving Averages on ETFreplay are calculated using Total Return. i.e. the calculation does not just use closing prices but also accounts for the receipt and reinvestment of any dividends and distributions. The MA is then compared to the Total Return value of the ETF, so that it's like-vs-like; everything is Total Return, not just price.
See:
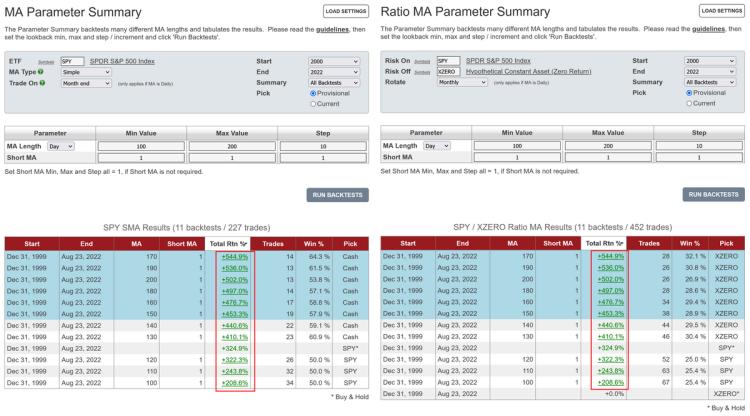
SPY MA Parameter Performance Summary on the left. SPY / XZERO Ratio MA Parameter Summary on the right. The backtest returns are the same.
Oct 17, 2021
in Backtest, Relative Strength, TRD Total Return Diff, Video, Ratio, Parameter Summary
Instructional video on how to use the Parameter Performance Summary functionality. #STUDY
to expand video on screen, click the '4 expanding arrows' icon in the bottom right corner of the video screen. Use the settings icon to change to 1080 quality if it seems at all blurry
Aug 31, 2021
in Backtest, Moving Average, Channel, Ratio, Parameter Summary
We have added three new Parameter Performance Summaries to the website:
As with the Relative Strength and TRD summaries that we introduced in July, each of the above can be accessed from their respective backtests.
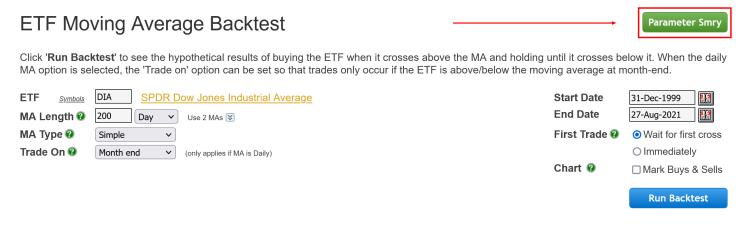
Set the min, max and step / increment for each parameter, then click 'Run Backtests' and the tabulated results will be displayed:
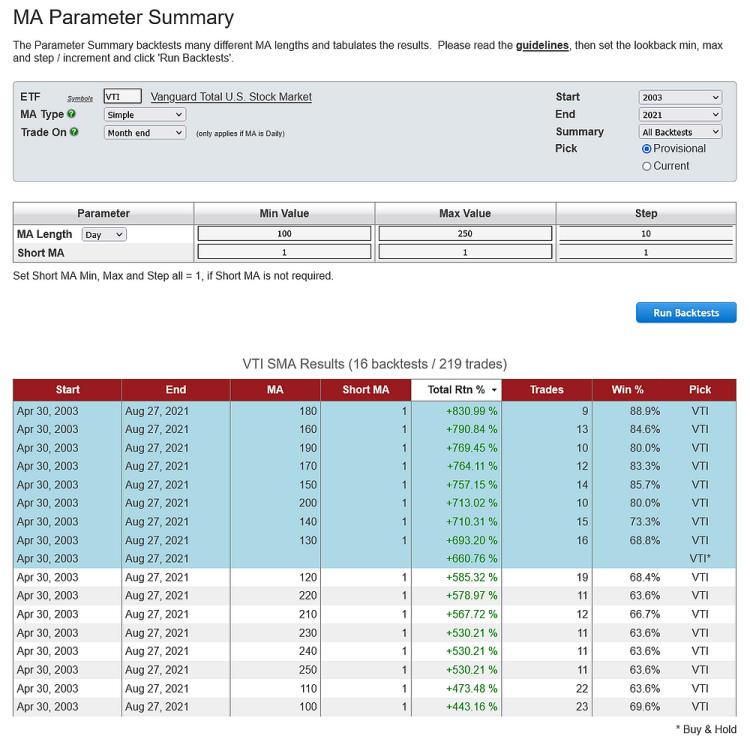
Parameter Performance Summaries are available to all (regular and pro) annual subscribers.
** studying the guidelines that we published within the original Parameter Summaries announcement is highly recommended **
Apr 23, 2019
in Ratio
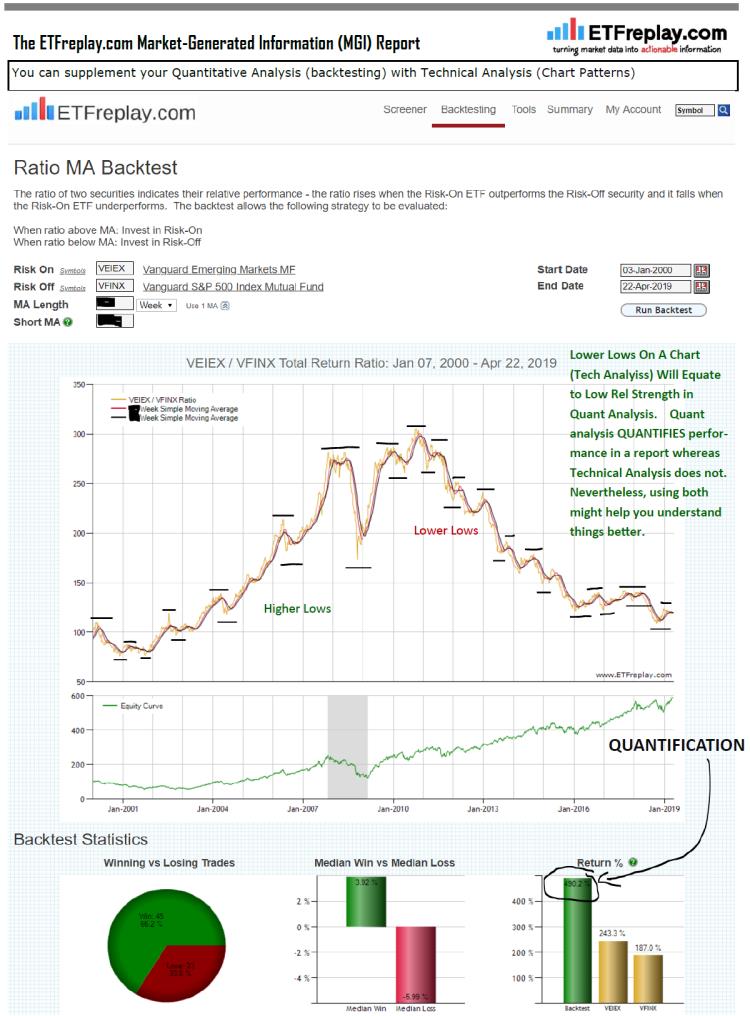
An uptrend is a series of higher highs and higher lows. Using a ratio between 2 securities shows which is relatively stronger. A Relative Strength analysis can quantify which security within a list of MORE THAN 2 securities is strongest.
So let's look at one current situation. Emerging markets have shown good relative strength on shorter-term basis. If this continues then a higher low and higher highs situation could develop (vs SP 500). That said, SPY has continued to be strong -- both Emerging markets AND US Stocks have been strong this year. It actually hasn't mattered which you've owned --- so even if you were wrong on thinking a ratio would go up/down, you still made good money either way. This won't always be the case though.