May 20, 2026
in RS Composite
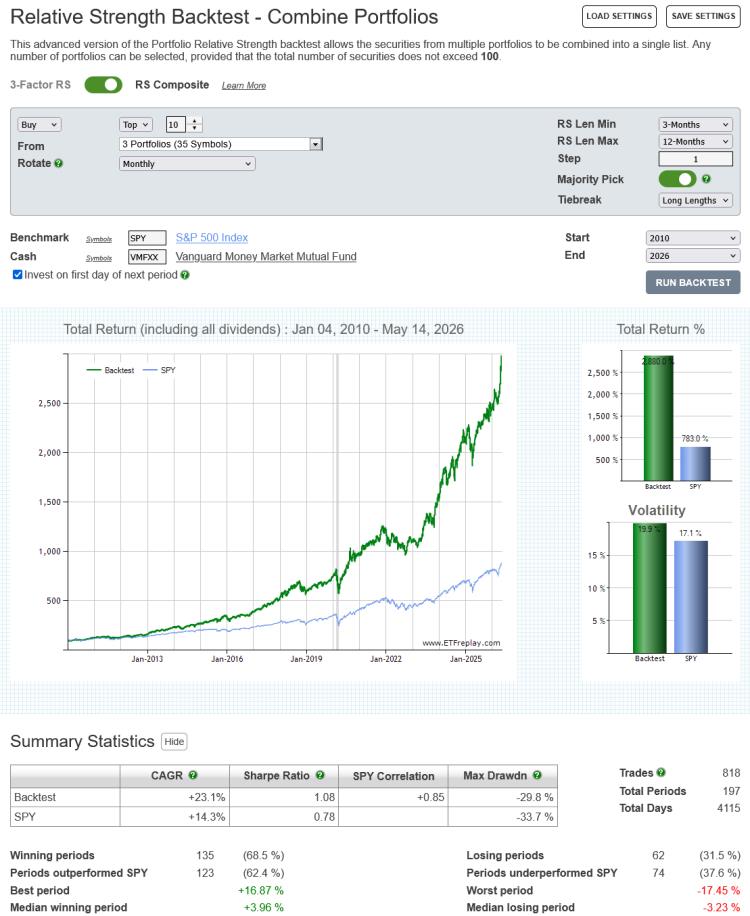
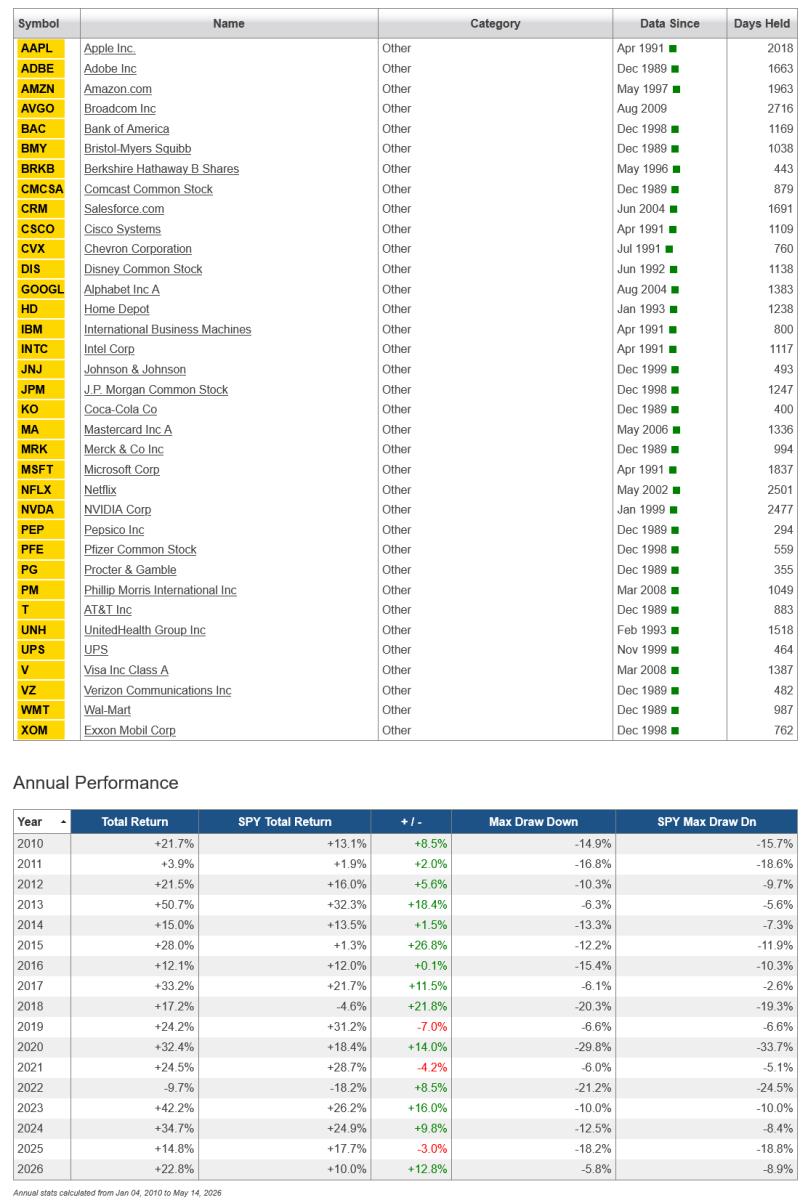
We have enhanced the Relative Strength - Combine Portfolios Backtest by adding the option to test RS Composite models.
The RS Combine Portfolios Backtest allows multiple portfolios to be combined together into a single list, making it possible to test investing in the strongest (or weakest) security from up to 100 symbols.
Annual subscribers, both pro and regular, now have the option to switch from using 3-factor Relative Strength to an RS Composite model.1
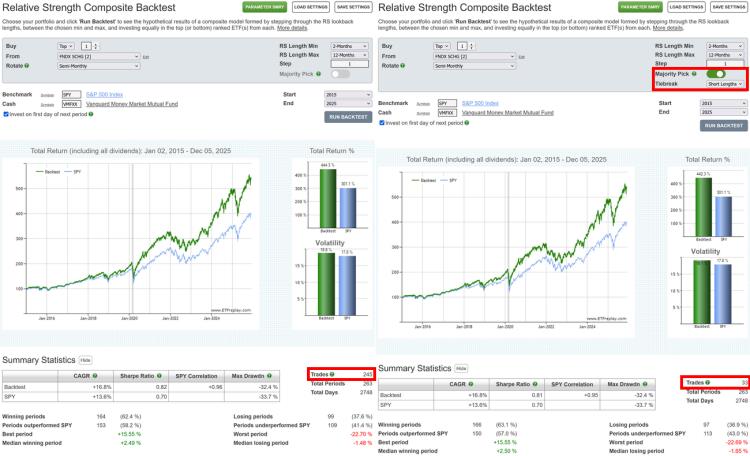
Pro subscribers also have the option to enable the Majority Pick function when running an RS Composite backtest, as per the example below.
click image to view full size version
Go to the Relative Strength - Combine Portfolios Backtest.
Note:
1. For more details on the difference between the 3-factor Relative Strength model and RS Composite, see Relative Strength: 3 Factor vs Composite
Mar 24, 2026
in Ratio, Parameter Summary
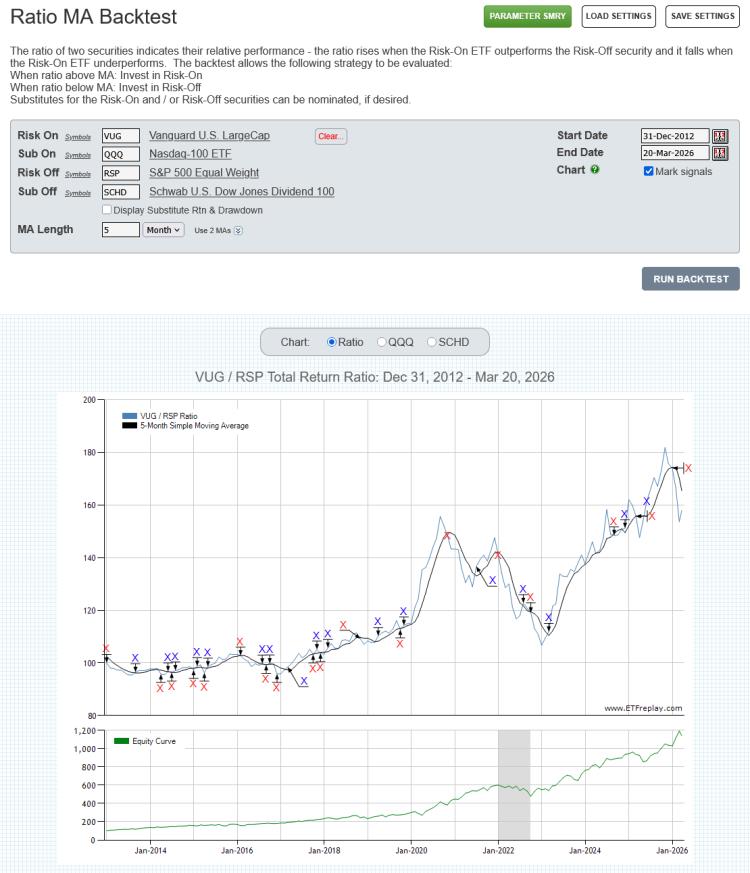
Last year we added a Substitute function to the Moving Average and Channel backtests, which made it possible to specify a different / replacement security for the execution of the trades.
We’ve now also added Substitute functionality to the following:
A Substitute can be nominated for either the Risk-On Security, the Risk-Off security, or both.
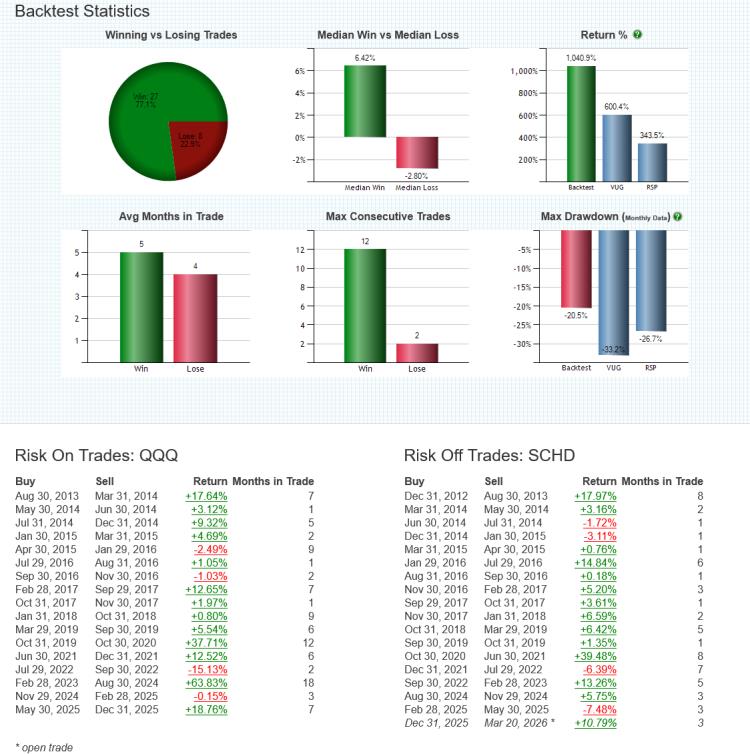
In the following Ratio MA example, when the VUG / RSP ratio is above its 5-month moving average (i.e. the ratio is trending up because VUG is outperforming RSP), rather than buying VUG, the backtest invests in QQQ. When the ratio is below its MA, the backtest switches to SCHD.
click image to view full size version
note:
The Ratio MA Composite Backtest and Ratio MA Parameter Performance Summary are available to all (regular and pro) annual subscribers.
Jan 26, 2026
in RS Composite
We have upgraded the Core-Satellite, Regime RS, Core-Regime RS and Advanced RS Pro and the Relative Strength backtests.
Last month we added a Majority Pick option to the Relative Strength Composite backtest. Now, Pro Subscribers wishing to reduce trade activity, can employ the Majority Pick option when testing a composite model on any of the aforementioned RS backtests.
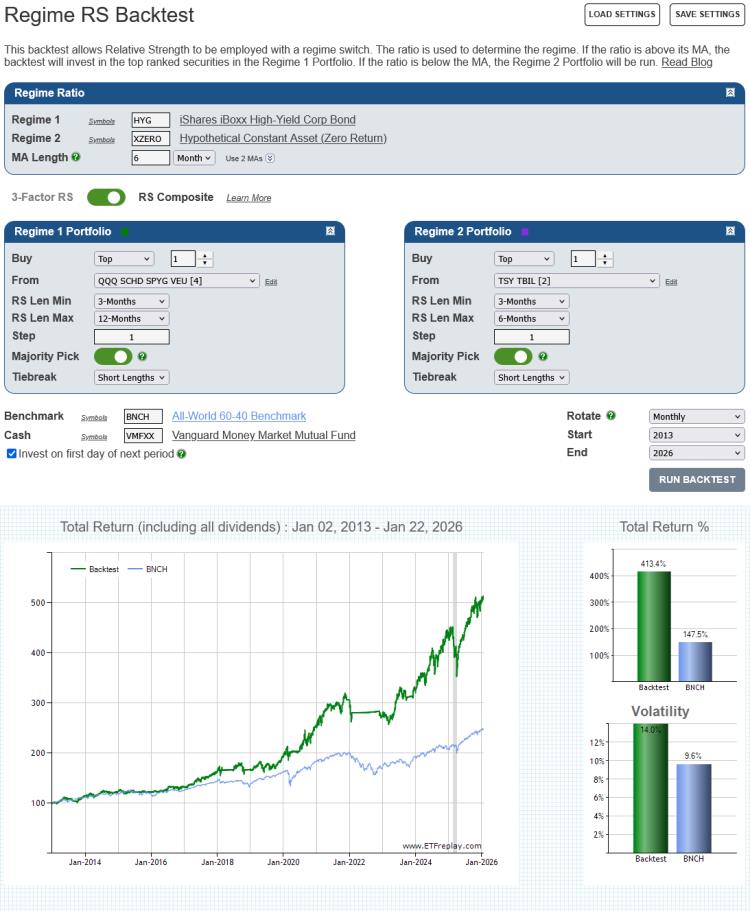
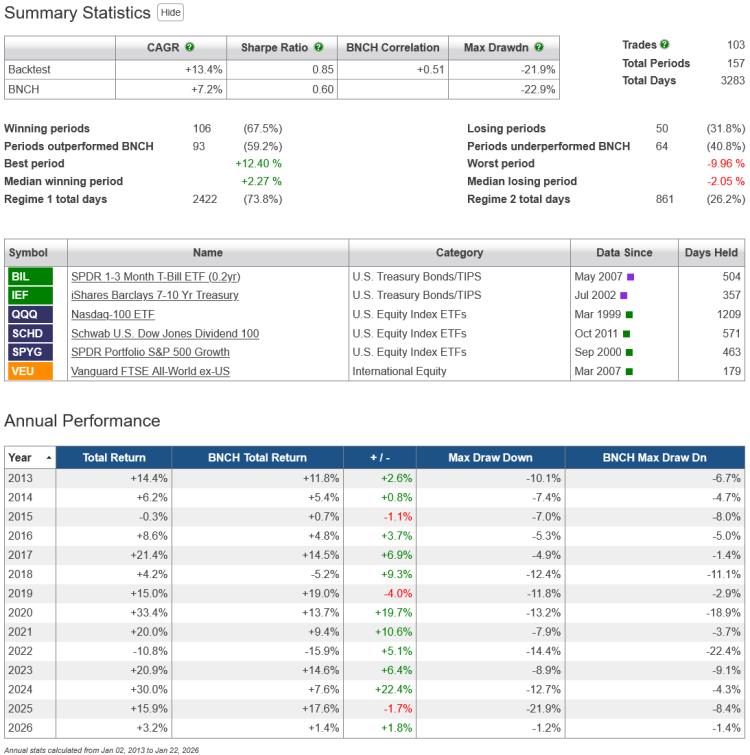
The example below uses HYG versus its 6-month moving average as a regime indicator to switch between stock and bond RS strategies.1 When HYG is above its 6-month MA, the backtest will run the equity strategy and with Majority Pick turned on, rather than investing in the ETF picked by each of the chosen RS lengths (3 through 12-months), the backtest will instead invest only in the ETF that’s been picked by the majority of RS lengths.
When HYG is below its 6-month MA, the backtest will switch to running the bond relative strength strategy. As Majority Pick is turned on, the backtest will invest in the bond ETF that ranks first by the majority of the four RS lengths (3, 4, 5 and 6-months).
click image to view full size version
Regular subscribers can upgrade to a Pro Subscription at My Account > Subscription Settings > Upgrade to Pro.
note:
-
XZERO is simply a zero return index (i.e. it's a constant), consequently an MA of the ratio HYG / XZERO is the same as a moving average of HYG itself. See Using SPY as a regime switch.
Dec 09, 2025
in RS Composite
We have added a new option to the Relative Strength Composite backtest for Pro Subscribers; Majority Pick.
If Majority Pick is turned on, rather than investing in the security picked by each RS length, the backtest will instead invest only in the top / bottom X securities that have been picked by the majority of RS lengths.
Though it sacrifices some of the diversification benefit of the full / regular composite, the Majority Pick reduces trade activity, often significantly, while still retaining the spirit of the composite approach.
click image to view full size version
Tiebreak
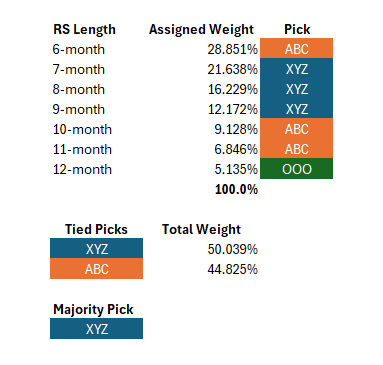
In the event of a tie, where two or more securities have been picked by an equal number of RS lengths, then each of the chosen RS lengths will be assigned a weight and the security with the greatest total assigned weight will be picked.
By default the assigned weights decline exponentially from the shortest RS length (i.e. shorter lengths have greater weight). However,if preferred, you can opt for the weights to decline exponentially from the longest RS length, so that longer lengths have greater weight.
In the example below ABC and XYZ are tied, each the pick of 3 RS Lengths. On a tiebreak, the majority pick is XYZ, as the weights assigned to the RS lengths that picked XYZ total 50.039% versus 44.825% for the RS lengths that picked ABC.
Regular subscribers can upgrade to a Pro Subscription at My Account > Subscription Settings > Upgrade to Pro.
Go to the Relative Strength Composite backtest.
Nov 03, 2025
in Total Return
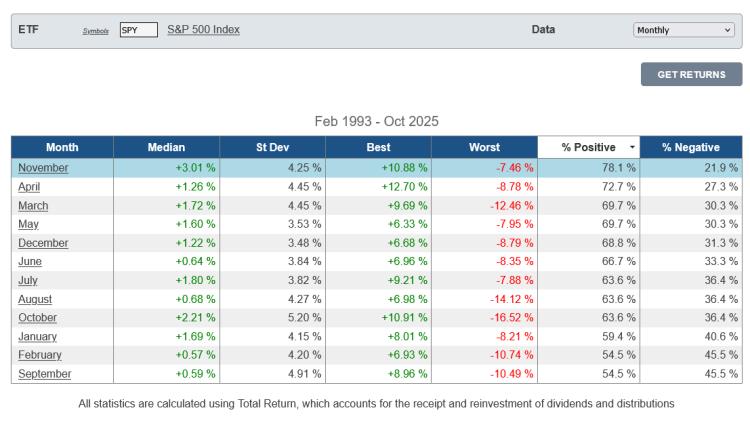
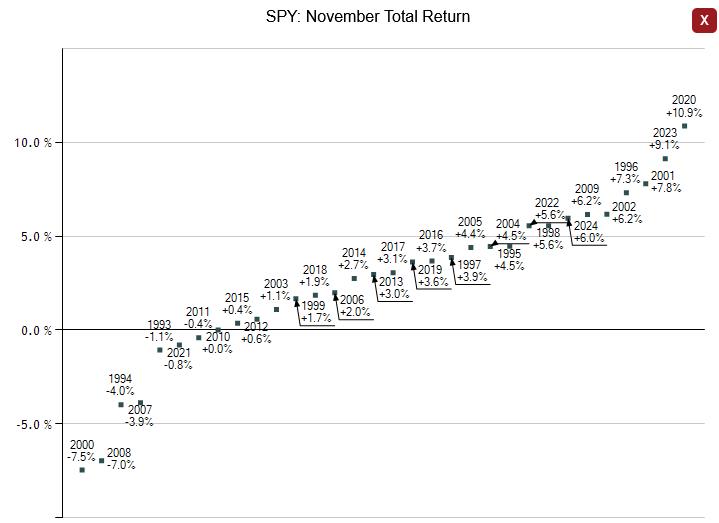
SPY returns have been positive more frequently in November than any other month of the year. Since its inception, SPY has produced a median return of 3% in November and been positive 78% of the time.
click image to view full size version
Its best November return so far has been +10.9% in 2020 and its worst -7.5% in 2000. 2021 was the last time it posted a negative return in November (-0.8%).
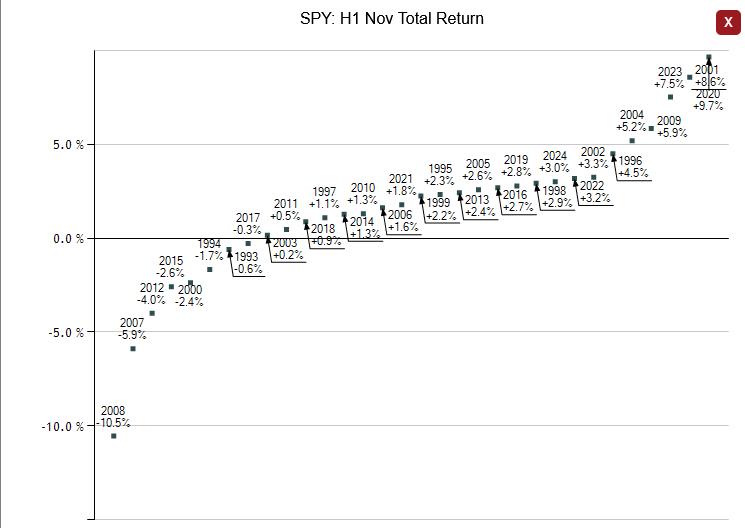
The first half of November has historically been stronger than the second half of the month for SPY; its median return for the first half of November is +2% and it’s been positive 75% of the time versus a median return of +1% with 71.9% positive for the second half.
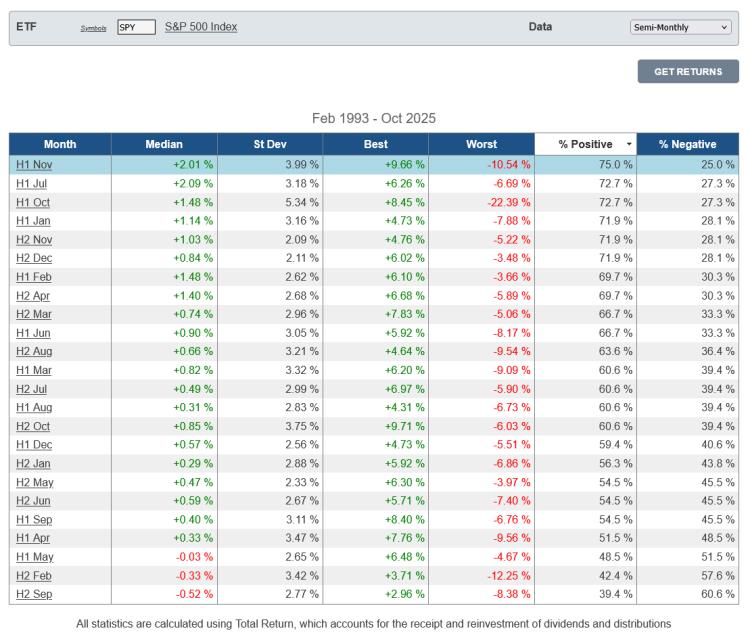
SPY’s worst first-half November return so far has been -10.5% in 2008. It last produced a negative return for the first half of November in 2015 (-2.6%). In 2015 the second half of November reversed the first half decline and SPY finished the month positive.
QQQ has also been positive more frequently in November than any other month, though it is also the month with the highest standard deviation.
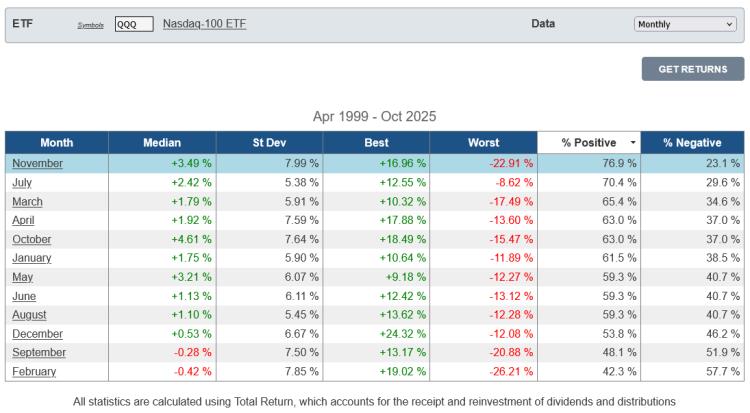
click image to view full size version