Jan 19, 2011
in Down Days
As we enter a period of higher volatility after a long sustained move up in equities, we ran some statistics on 25 of the largest ETFs in the world to see how they performed on a relative basis when the S&P drops X%.
In this case, we chose to use 10 S&P pts, which works out to about 0.75%. How did various ETFs perform on just those particular down days?
Since the March 2009 low, the S&P 500 has dropped in excess of -0.75% eighty-five times. The average S&P 500 loss for these 85 days was -1.68%. Here are some results for 25 ETFs which summarize their performance on just those 85 days:
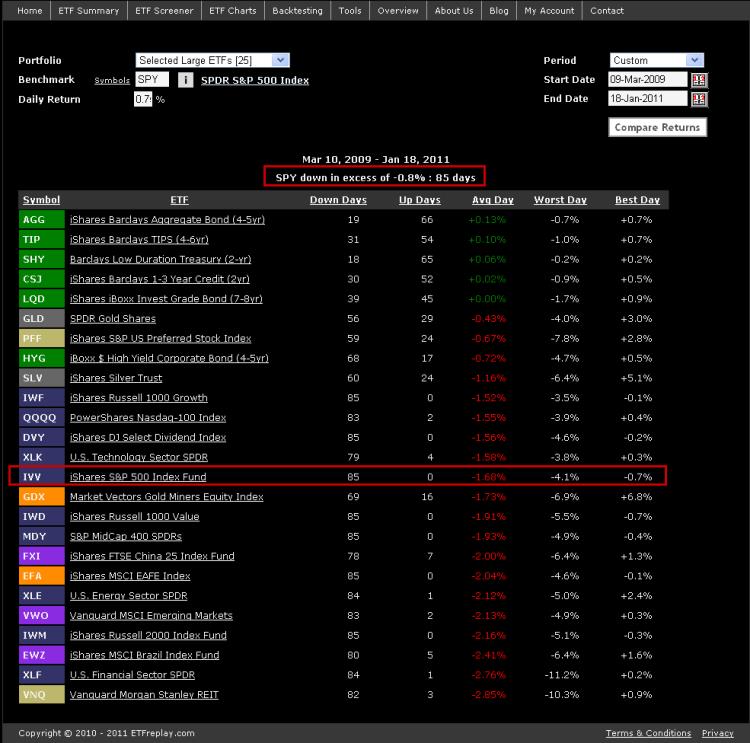
You can see that among the worst for this period were REITs (VNQ), U.S. financials (XLF), Brazil (EWZ) and U.S. Small Cap Stocks (IWM). It makes sense, these are all higher volatility market segments. Technology stands out for doing a bit better than you might have expected.
Bond indexes have low standard deviation and low correlation to U.S. stocks so they generally rose --- but as you can see, very modestly and not nearly enough to offset much of the loss in equities.
Gold, Preferred Stocks and High-Yield Bonds all show losses on average -- but more modest losses given their lower correlations with stocks. Dividend ETFs (DVY, SDY) were down on all 85 days (85 for 85) -- which isn't a big surprise. The dividend indexes didn't do particularly well on a relative basis however and lost almost as much as the S&P 500.
Now let's look at todays (Jan 19th) drop in various markets:
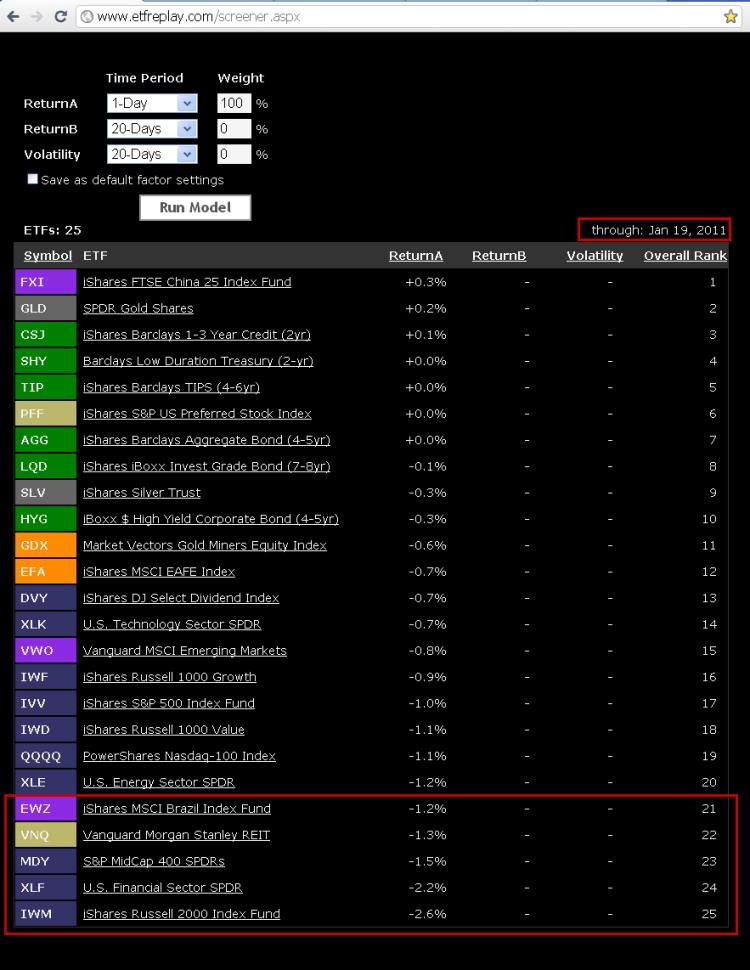
At the bottom of the list of todays (1-Day) performance are the exact same ETFs as the first list.
A couple of ideas here:
1) If you think you are going to get any diversification benefit from owning REITs in a down S&P market, we would tend to doubt that.
2) Bonds don't provide much absolute protection in S&P 500 down days --- but they do obviously serve their purpose of stabilizing a portfolio.
3) Dividend stocks may offer only modest protection in down markets.
Note that the China ETF (FXI) went up slightly today -- so there is the outlier of the day (of course no conclusion to draw here off 1 day of data).
Summary: it helps to study volatility and down markets. Todays performance was quite consistent with the same relative stats of the last two years.
Update: The first screenshot is now available in application form -- because it runs by auto-loading your user-created portfolios, it needs a login to access the page: ETFreplay Tools Page