ETF Market Generated Information Is The Best Information: A look back at 2016 Election
Aug 29, 2017
in Sectors, Trend Quadrants
Let's look back to 2016 and the market environment in the lead-up to the U.S. presidential election. What were the market conditions telling you?
Is the market moving TOWARD higher-beta, risky, higher-return-but-more-volatile assets? Or is it moving AWAY from those and into lower volatility, lower risk, safer assets? This is what actually matters.
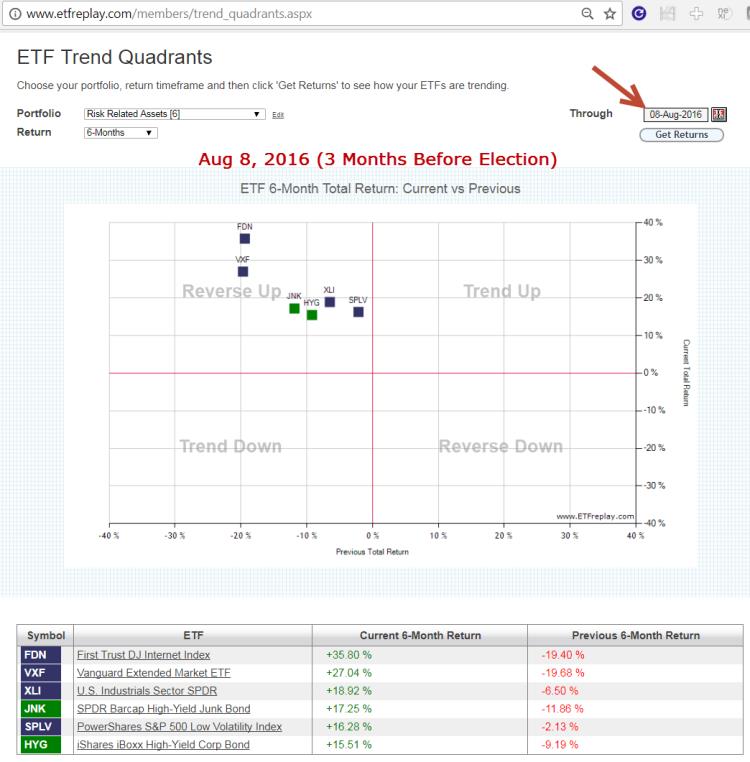
If you take a snapshot of the market 3 months prior to the election, you can see various risky assets in 'Reverse Up' position. That is, their 6-month returns were up while the previous 6 months had been down. We can view this on our ETF Trend Quadrants module (located on the ETF Tools page):
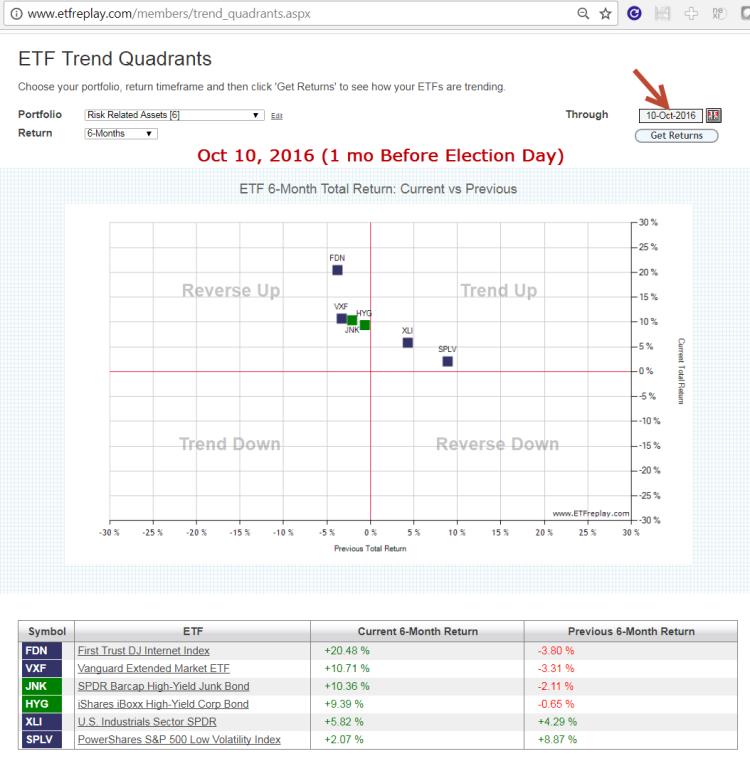
Here is the position 1 month prior to Election Day. Note ETFs here are moving to the right. This represents money flows IN.
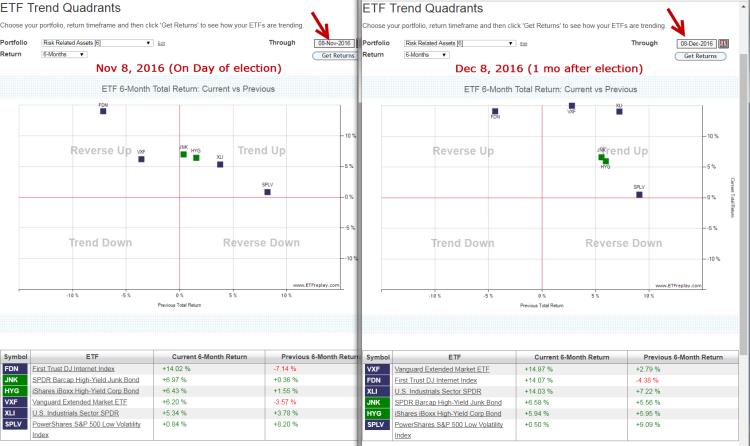
And then we align 2 browser windows to show Election Day and 1 month after:
Let's also cross-reference this thesis by looking at the credit markets, High-yield bonds vs Treasuries in ratio moving average form:
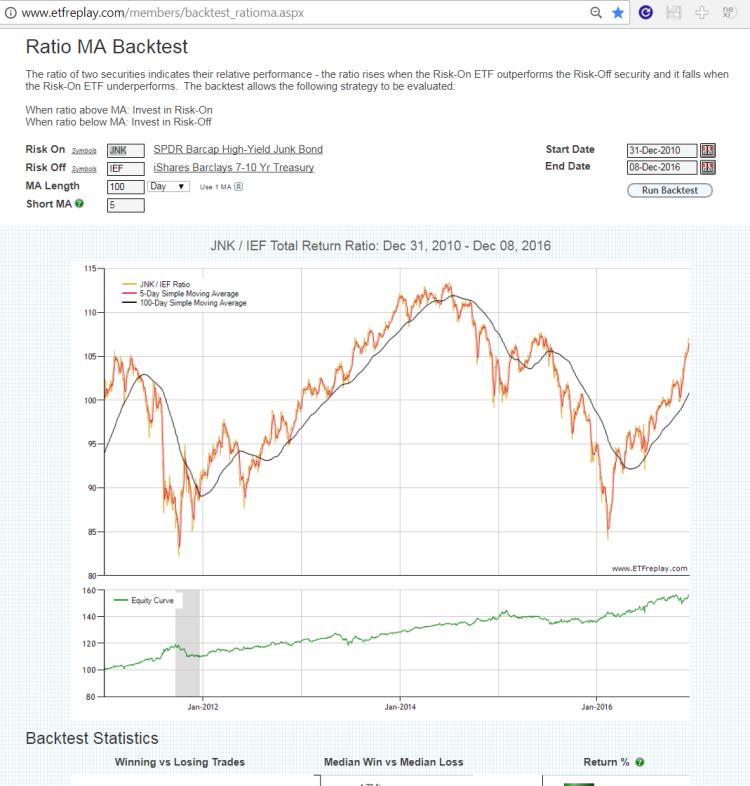
From 2014 into early 2016, high-yield bonds had under-performed treasuries materially. But a sharp V-spike reversal occurred in this ratio in early 2016. It was not unreasonable to think a new period of risk-on was possible if not likely given the 2014-16 relative drawdown.
The point of all this is NOT that these ETFs predicted the election. They didn't. The point is that the market conditions were bullish and this was visible in looking at the many intra-market relationships via ETFs. Sometimes the markets will whipsaw around in a tricky trading range -- but often times the markets follow the flows and 2016-17 is a real nice example of this.
Our Twitter feed on November 9, 2016 made this point as well:
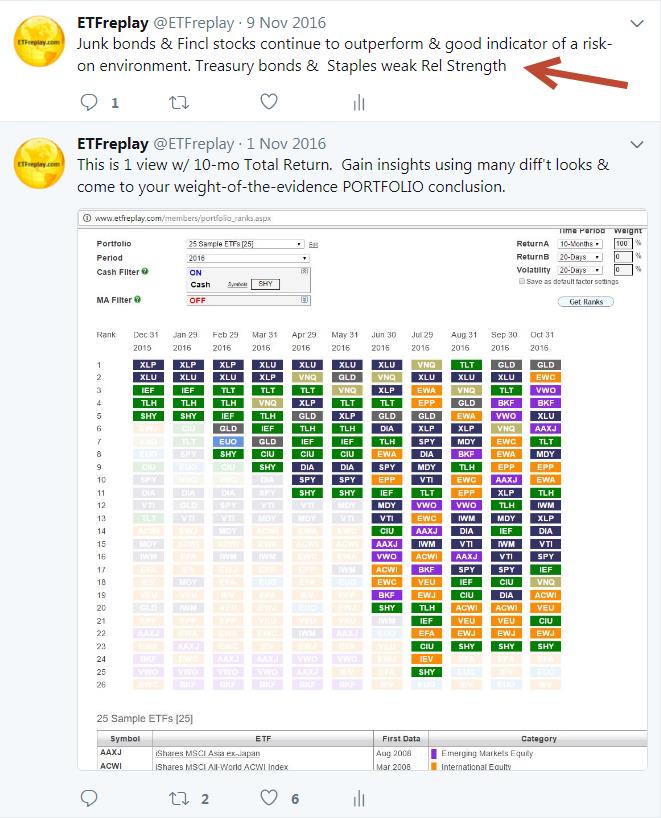
Follow ETFreplay on
