Category: Ratio
Jan 23, 2017
in Regime Change, Ratio
Last month we did a blog post on using high-yield bonds as a key indicator. This month we continue with a focus of using financial stock ETFs as a second indicator.
Many people seem to want to try to simplify everything down to one variable -- often something like a P/E ratio or a moving average. We think investors should look at a range of important indicators and then take a weight-of-the-evidence approach. Indeed, we built ETFreplay.com so that you can easily run and update a list of strategies AND do this on a continuous basis and thereby stay in tune with the overall structure of the market.
There is no better information than that which the market itself generates. A good market participant will learn to read what the market structure is telling you by analyzing its intermarket relationsihps.
Financial companies have business models that make our economy go. From mortgages and credit cards for individuals to bank loans and payment services for corporations, financial companies are absolutely vital indicators on overall conditions and this is why these companies are regulated closely by government agencies.
It makes sense that when financial stocks are doing well, how bad can the market environment be?? Look back at past recessions and you will see very poor performance of financial stocks.
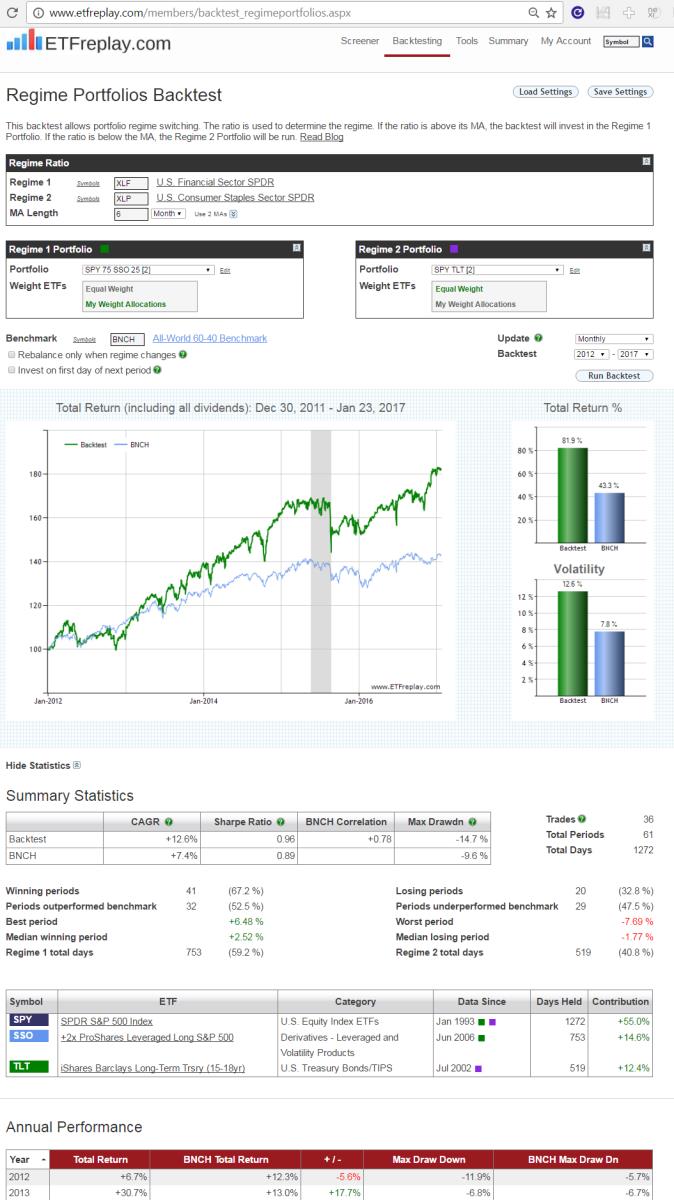
The backtest below is meant as an INDICATOR -- not a strategy to implement per se.
When financial stocks are beating a known risk-off stable segment like US Consumer Staples, we will bring our portfolio Beta up above 1.00 by adding a 25% position in SSO (the 2x S&P 500 ETF).
When financial stocks are underperforming, we will split our holdings into 50% SPY and 50% TLT. This is the 'risk-off' portfolio. (Note that in this example -- no matter which regime is in play, the portfolio will hold at LEAST 50% SPY -- think of that as the 'core' portfolio and the other 50% as the 'satellite').
Here are the results. Make sure to dive-in and immerse yourself in this topic. Alter the time periods incrementally. Alter the risk-on risk-off portfolios. Study sub-period backtests. What are the good aspects to this backtest? What are the possible limitations?
Oct 17, 2016
in Ratio
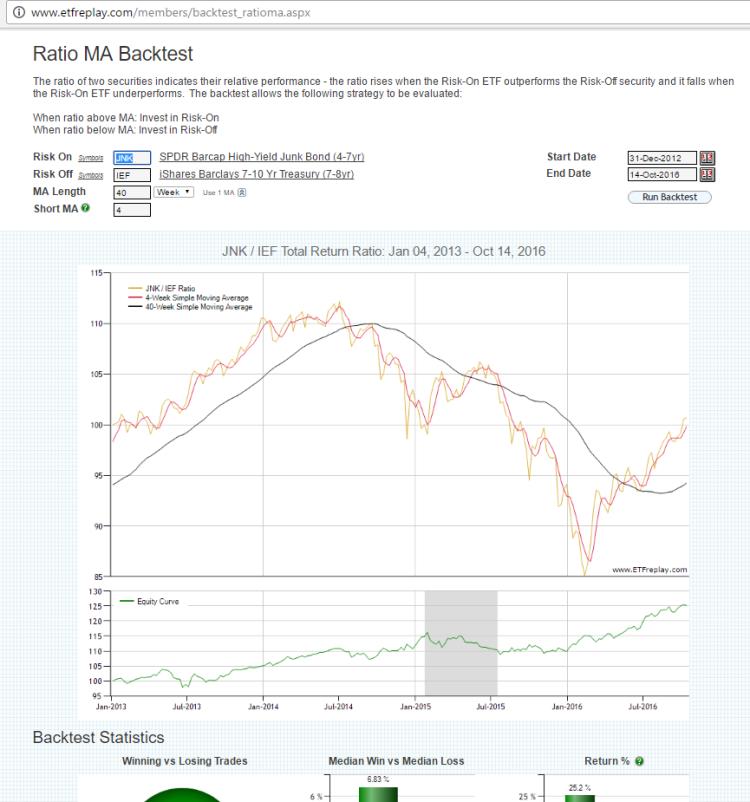
Every recession has something in common: investors flee junk bonds. You do NOT have to predict this, you only need to monitor it.
Junk bond investors got worried in late 2014 and much of 2015 -- and the stock market went effectively nowhere during that time (while High-Quality and Low Volatility segments outperformed strongly).
Most of 2016 has seen a decent bull market in junk bonds. Since fixed-income investors are very sensitive to their income actually being fixed --- and not variable, this group of investors is a very useful group to track.
Sep 02, 2016
in Ratio
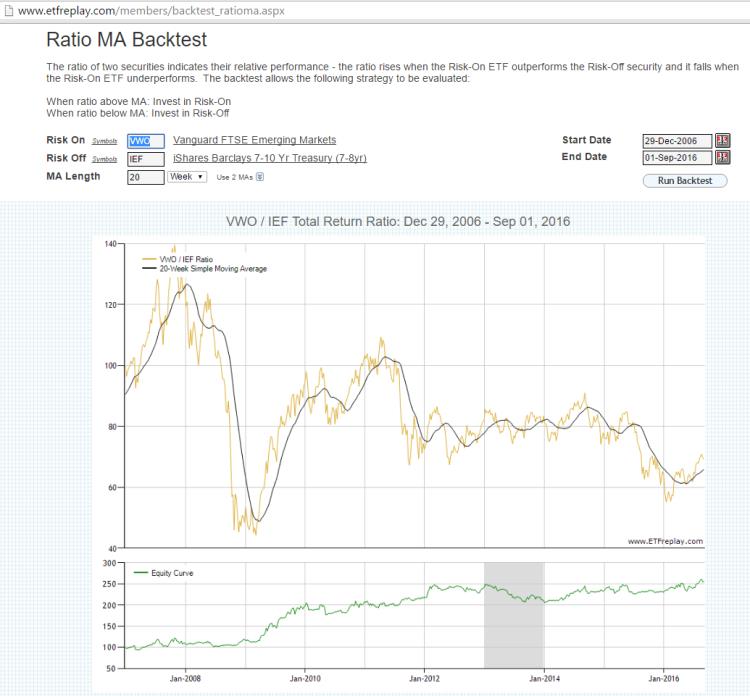
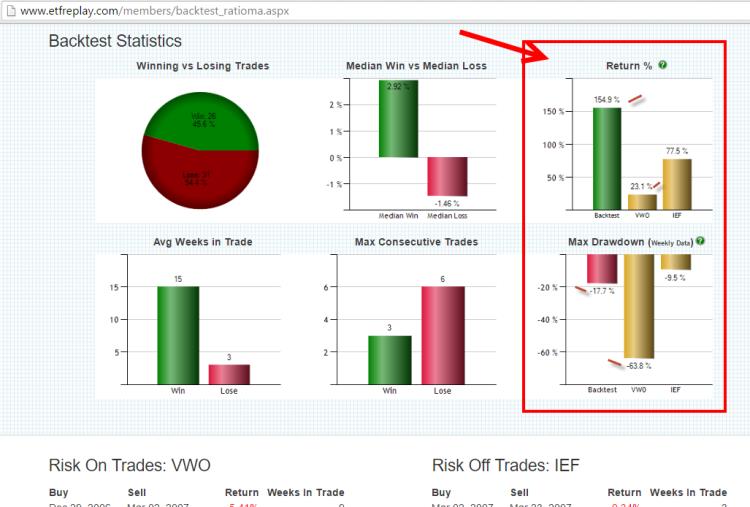
There are lots of ways to skin a cat of course. Here is a look at results of using a simple total return ratio between Emerging Markets (VWO) and an iShares Treasury ETF (IEF):
Dec 01, 2012
in Ratio
Quick mini-analysis of an ETF we are long in our Allocations Board models (EPP).

Here is a summary of the rationale:
We went long EPP on an Allocations Board portfolio during a small pullback in late August. (members can see allocation board for details). Why EPP and why then?
First, EPP is a regional ETF covering developed markets in the Pacific ex-Japan region. This means companies based in Australia, Hong Kong & to a lesser extent Singapore and New Zealand. Note that none of these are considered emerging markets --- though all are clearly closely tied to the growth of Eastern Asia, which in turn are all emerging Markets (ex-Japan).
EPP began by performing well on a relative strength basis during the summer of 2012 vs various lists we keep on constant monitor.
EPP is very volatile -- so we wanted to expose the model to strong relative strength -- but also be sure to plan ahead in case things went adversely against us. This can be a tricky situation because you absolutely must give yourself a chance to participate in the uptrend by giving it some room in the short-run ---- but we wanted also to have a plan in place to avoid large portfolio drawdowns. Below is a snapshot using the Ratio MA module to manage the individual position. Also included are some pullbacks which are normal for a volatile security like this. These would be buying opportunities within a perceived uptrend. This is not meant to be how anyone else should choose to manage a position. This is just a snapshot of how we were thinking about it.
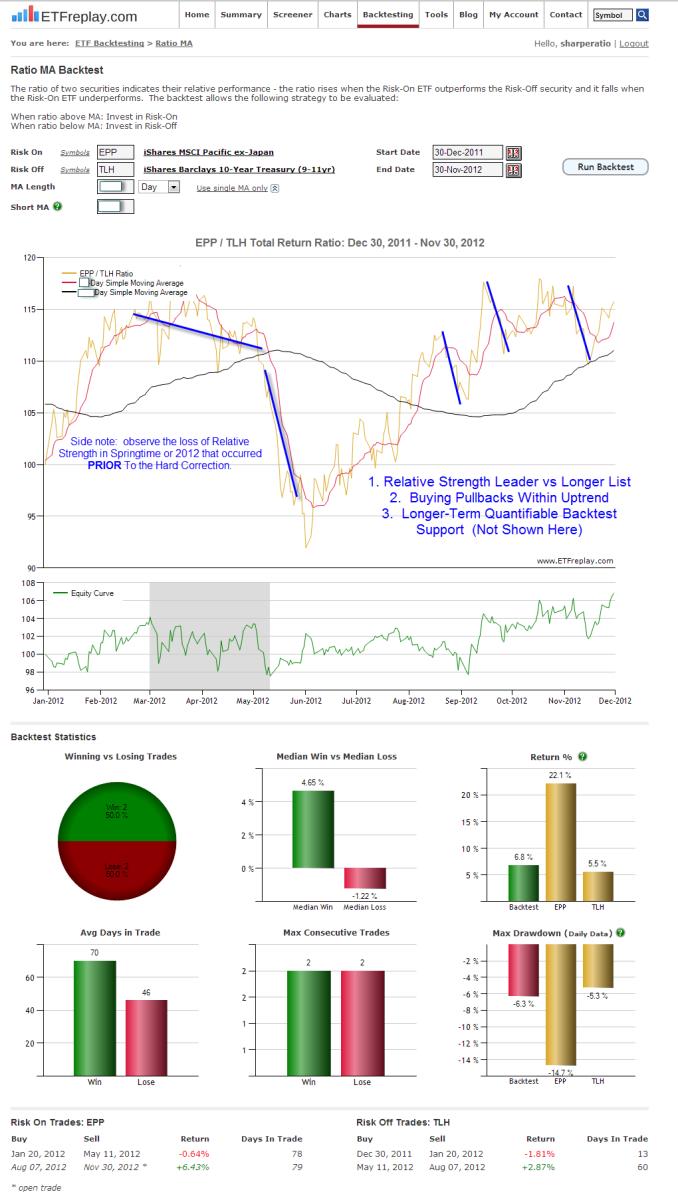
The exact parameter settings should not be the focus here. Investing is not a pure science, in our view. It is much more like a game of poker, partly mathematical and partly behavioral/psychological. Good poker players don't take wild risks with no plan in place if things go adversely. They start out with a plan for each part of the hand and then make adjustments and often have to make some tough decisions as more information is revealed that is adverse to their position. Sometimes they make a mistake and fold the best hand (like a trading whipsaw) --- but over time, good long-term decision-making is what makes a good investor (and a good poker player). PLAN YOUR HAND.
Note that the ETF in discussion here (EPP) was not chosen in the first place because of this ratio MA analysis -- that is just a second more detailed view of how we planned to manage the position. EPP was instead originally chosen because we like what the ETF represents on a fundamental basis (companies based in Australia, Hong Kong & Singapore) AND it also was showing strong signs of a new uptrend beginning (this is what good relative strength analysis does -- it locates particular strength in the market that over time suggests continuation rather than reversal).
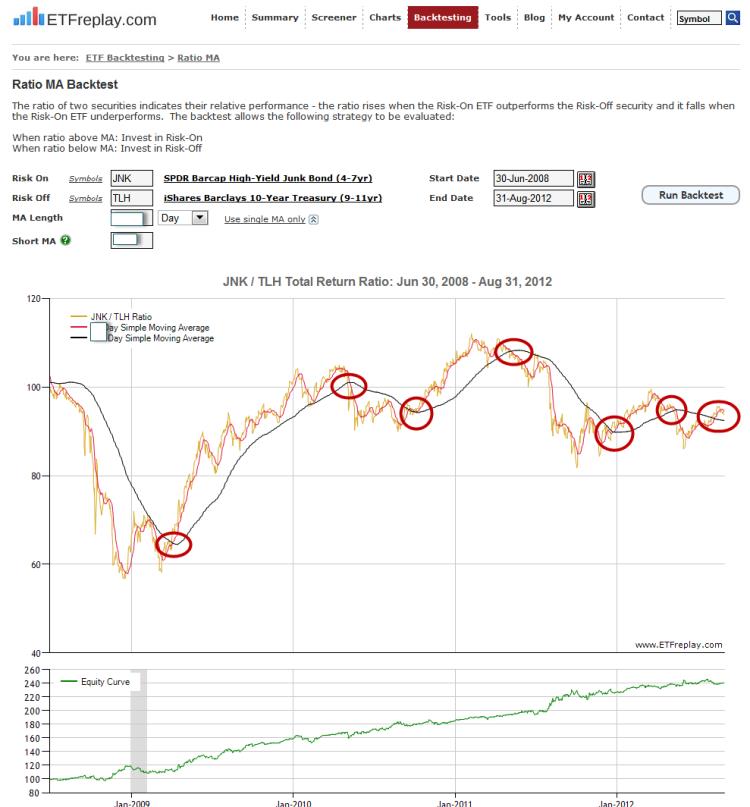
Aug 31, 2012
in Ratio
Credit markets don't appear to be too concerned about recession in United States. Junk Bonds have been outperforming Treasury Bonds lately.