Category: Drawdown
Jul 28, 2023
in Drawdown, Parameter Summary
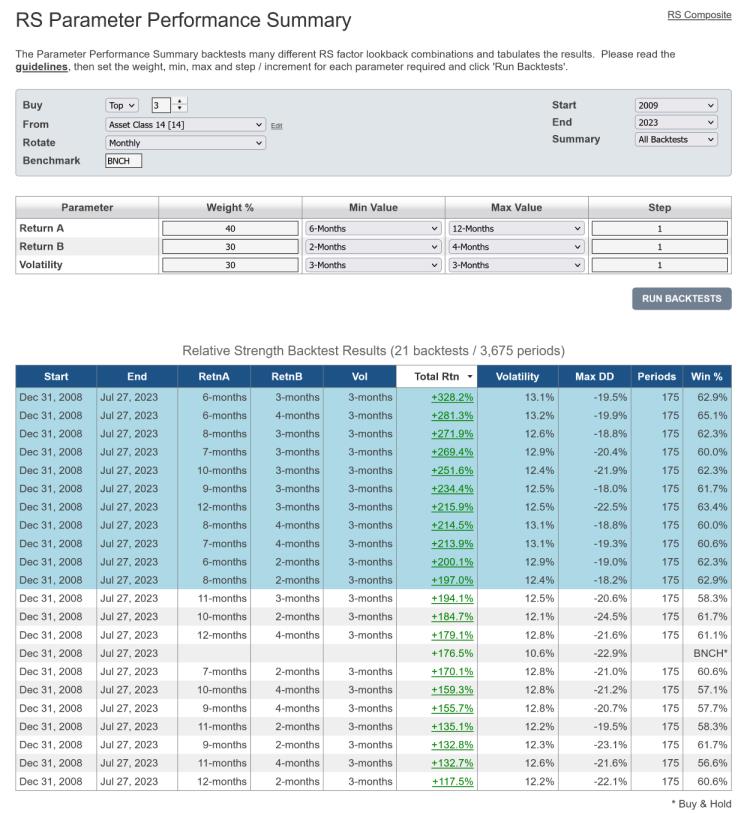
We have expanded the range of backtest statistics produced by the Parameter Performance Summaries with the addition of max drawdown.
The Parameter Performance Summaries make it possible to backtest numerous different parameter values in one go and assess the results. The table of backtest results is ordered by total return by default, but can now also be sorted by max drawdown (Max DD) as well as by win percentage, parameter value etc.
The Parameter Performance Summaries are available to both regular and pro annual subscribers:
As always, studying the guidelines that we published within the original Parameter Summaries announcement is highly recommended.
Jan 07, 2018
in Drawdown
Study many different sub-periods for many different markets. It helps you understand scenarios, it helps you understand strengths and weaknesses of various techniques in backtesting.
Learn how to put the odds in your favor. If you study many different time periods across many types of markets, you will gain understanding of a strategy that is fragile vs a strategy that is more durable. You will have ideas that cannot be supported and you realize their weaknesses. Running bad backtests and learning from that is part of the process.
Below is one look at the 2000-2003 bear market. We suggest you look at that time period and many other time periods using many different types of funds. QQQ's downturn was especially bad due to the extended run-up in the prior years (QQQ index existed in prior years but the ETF product QQQ of course did not exist prior to the middle of 1999).
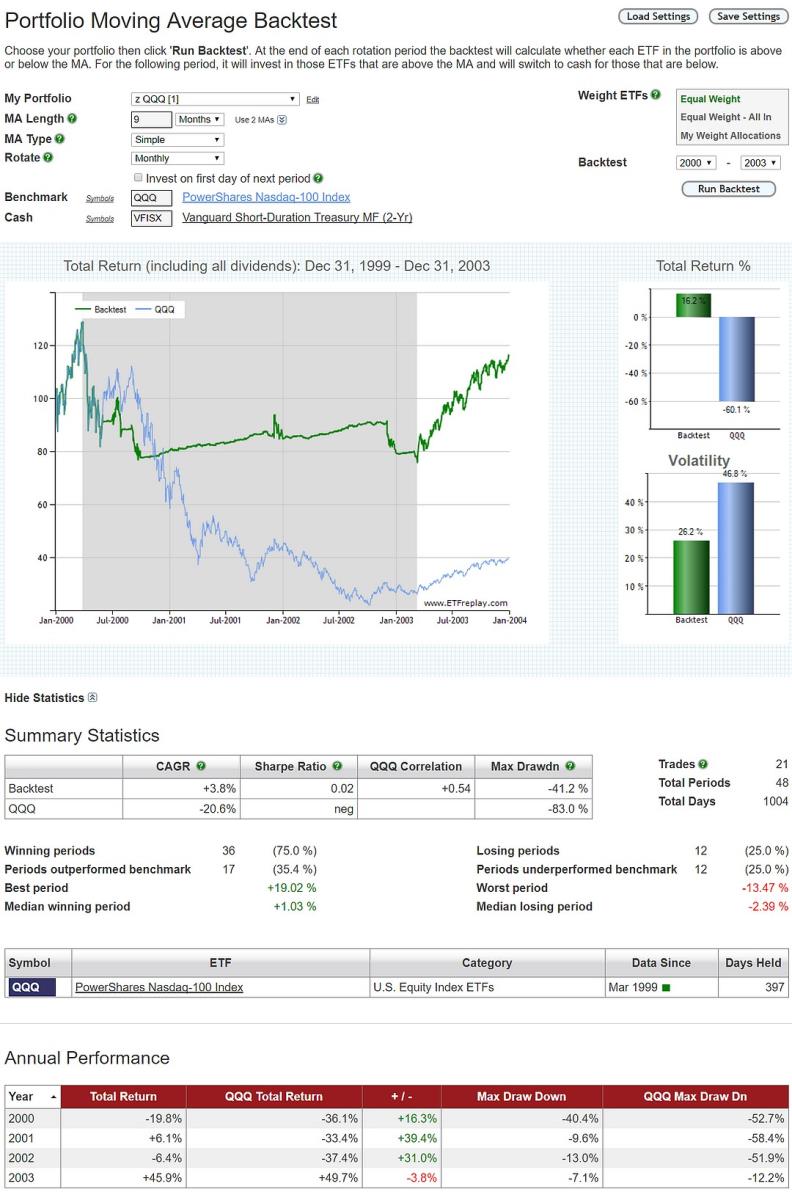
**A pro subscription allows you to backtest to 12/31/99 using daily total return data.
Oct 03, 2017
in Drawdown
Sep 27, 2017
in Drawdown
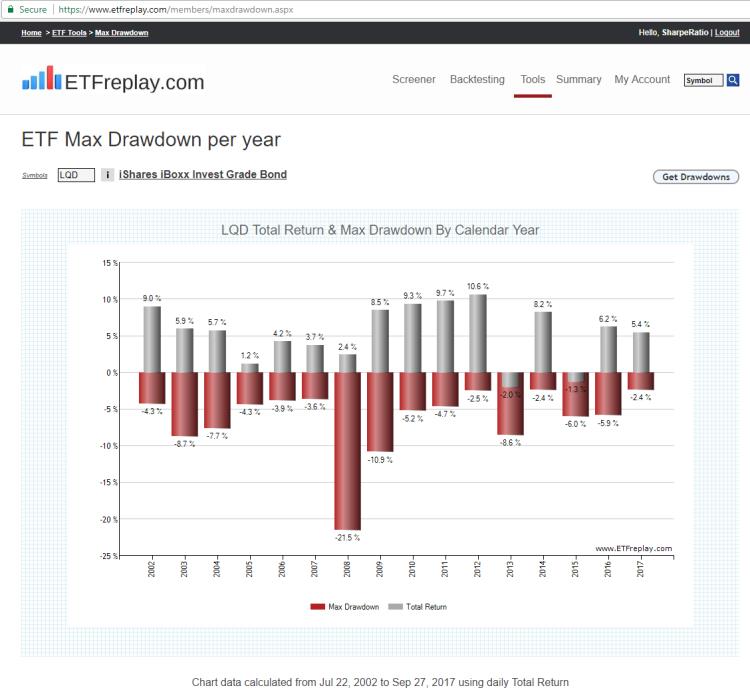
Over the past ~15 years, the bond market has generally had positive single-digit returns and also single-digit calendar year drawdowns. As the gentlemens asset class, bond ETFs generally don't have the anguish associated with the big drawdowns of many equity ETFs.
For a reference point, below is a snapshot of Calendar Year returns and drawdowns for LQD, an investment grade bond ETF:
What is remarkable about this year is the combination of high returns with extremely low drawdown in some traditionally high-vol, high-drawdown segments - such as emerging markets. 2017's max drawdown for emerging markets has actually been less than most BOND market years.
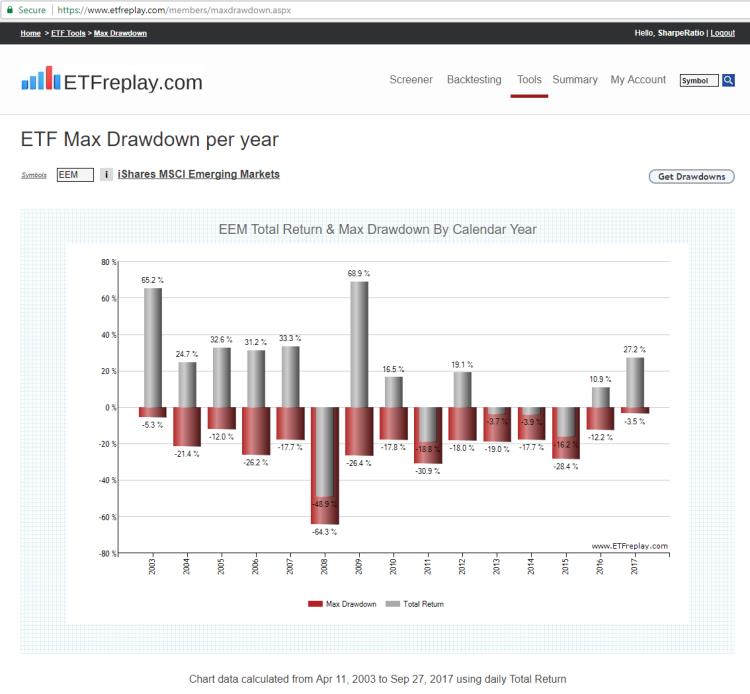
+27% YTD total return near the end of the 3rd quarter of 2017 vs just -3.5% drawdown. Obviously, strong return and Low volatility leads to high rankings in our Relative Strength models. Uptrends can have some violent short-lived corrections but investors can manage such volatility by tilting their portfolios away from the weakest segments.
Link to the tool in this blog (subscribers): ETF Max Drawdown
Dec 22, 2011
in Drawdown, Volatility
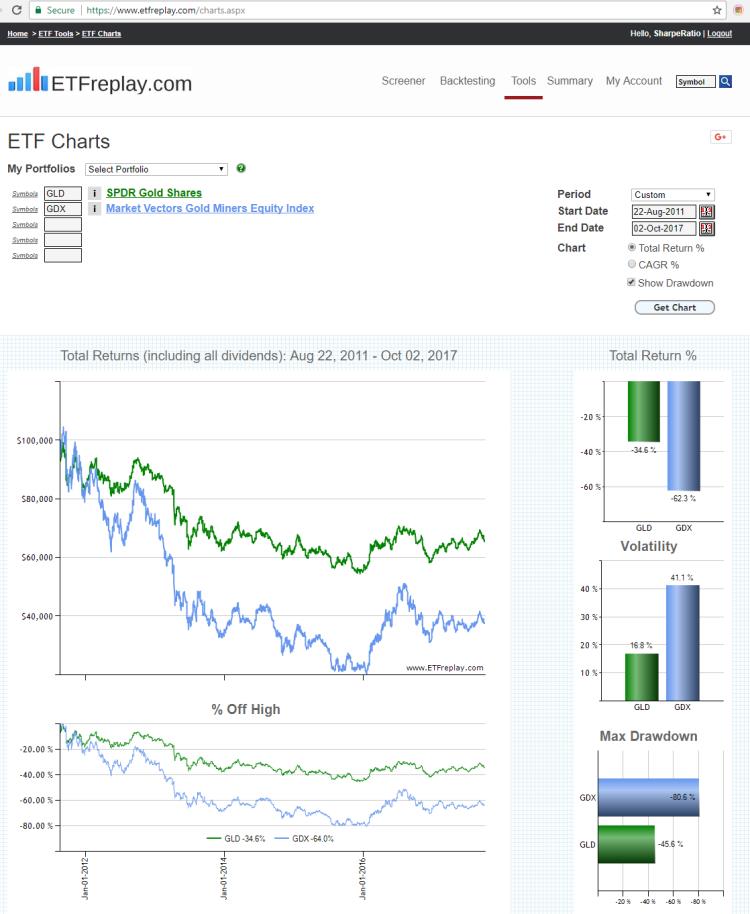
We are updating our 'Volatility vs Subsequent Drawdown' Chart for 2011. We did a similar post a year ago and you can review that blog post here: Understanding ETF Volatility Part 1.
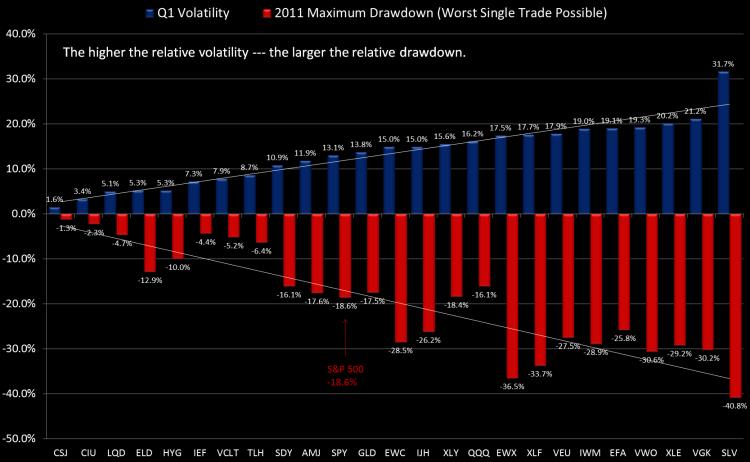
The way to read these charts is to simply note the relationship. By definition, high standard deviation investments offer wider opportunities for both out and underperformance. The S&P 500 dropped -18.6% off its high during 2011 (using closing total return values). This was -3.2% worse than the mid-year loss in 2010, when the S&P dropped -15.6%.
Gold had a more normal drawdown in 2011 at -17.5% vs 2010's -7.8%, due mostly to its more aggressive slope up during the summer. Gold never got particularly volatile in 2010 but in 2011 it traded more typical of a commodity market -- where there is often a momentum-oriented blow-off move. Still, if you were watching volatility dynamically, you would take note of it becoming riskier during the July-August advance.
The NASDAQ-100 actually dropped slightly less from high to low in 2011 vs 2010. Large-cap tech -- particulary AAPL have been relatively calm in 2011 -- which was also the case in 2010. Can it go 3 years with just a mid-teens drawdown? We don't know but there are certainly other more attractive segments as we close 2011.
It may sound odd but the losses in both 1) small cap US stocks (IWM) and 2) US Energy stocks (XLE) were about the same from high to low as the European ETF (VGK), which dropped -30%. However, both of the US ETFs have seen strong rebounds in Q4 and are a few percentage points from flat on the year.
Silver (SLV) is pretty consistently the most volatile (unlevered) ETF around and it didn't disappoint with a -41% high to low move in 2011 (and the year isn't quite over).
Treasury bonds ground out fantatstic years. We've blogged many times about how intermediate and low-duration bonds are the ultimate safe-haven. You can't count on consistent correlations in times of crisis -- but you can count on low-duration bonds, the fixed-maturity dates of the underlying securities ensure it. This is not true of long-term bonds -- which look susceptible to significant drawdowns in 2012. As much hype as the US downgrade received, it proved yet another meaningless move by the ratings agencies in the United States, which for some antiquated reasons seem to remain relevant to some.
Note that many ETF providers launched 'minimum volatility' ETFs in 2011. Since starting ETFreplay.com in early 2010 we have always used volatility as 1 of 3 key inputs in our multi-factor screener model -- so we are not surprised to see this development from the ETF providers. Volatility has and always will be important --- but it's certainly not the only thing that matters. Myopically focusing on volatility is taking this all too far as building ETFs off a singular concept like this is very limiting.
We view risk-adjusted (volatility-adjusted) relative strength as the cornerstone philosophy of ETFeplay.com and this led to a fixed-income bias throughout most of 2011. However, a tactical investment process continually looks to adapt to the environment --- and we would look for continue rotations in 2012 --- and every other year for that matter. There is plenty of room to add value in any year and it's up to you to figure out which group that is and how to manage it. In 2011, fixed-income ETF showed excellent total returns. You can't always be right of course --- but you can pursue a process on thoughtful consideration of which markets to be involved with --- and then layering some trend-following techniques on top of that --- all the while continually striving to protect yourself for the times you are wrong. If you simply stay consistently loaded in a group of highly volatile securities -- it is just a matter of time before you have a large drawdown.
As can be seen in our tracked Portfolio Allocations, we view equities to be attractive as we end 2011 -- particularly small and midcap US stocks. We see signs of P/E multiple expansion with rates low and liquidity being added to the problem areas of the global economy. However, even assuming we enter an intermediate uptrend (which may or may not occur), this does not mean that more rotations within the markets won't occur. It is never easy in the moment and we will carefully continue to watch and adapt to new potential themes/trends --- while always watching our backs to avoid too much portfolio volatility (and its associated drawdown).