Jul 28, 2010
in Relative Strength
This summer is a good reminder that ETF investing does not revolve exclusively around equities. After assuming a leadership role in early May, many non-equity forms of ETFs have made repeated new highs over the past few months. Treasury Bond ETFs have been the most obvious example of relative strength but other groups performing well include: the Master Limited Partnership products (AMJ), Emerging Market Bond ETFs (EMB, PCY), Preferred Stock ETFs (PFF,PGX, PGF) and more recently, U.S. Utility Stock ETFs (XLU, IDU, VPU).
What do the majority of these ETFs have in common? Most of the recent 6-month ETF list of new highs involves indexes associated with yield (and lower relative volatility vs the S&P 500).
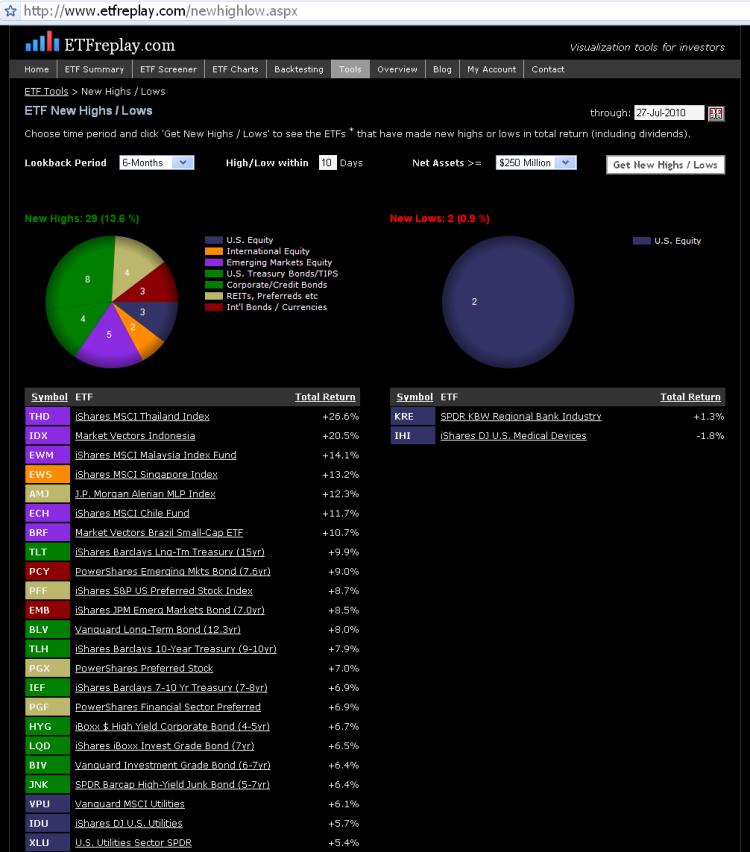
Try the interactive functionality of the above webpage here: New Highs and Lows App
With regard to equities, we’ve seen some new multi-month highs made in some select Asian and Latin American equity indexes. We will be watching to see to what extent other equity country funds can confirm this new potential leadership area (emerging markets equity).
U.S. stocks made fresh six-month lows at the beginning of this month. The drawdowns of some of the primary indexes this year have been -15.7% for the S&P 500, -20.1% for the Russell 2000 (IWM) and -22.8% for the Vanguard Europe ETF (VGK) (drawdown is the maximum high to low correction using closing prices). These groups have rallied hard over the past 20 days but they appear to be in a holding pattern as evidenced by their poor/mediocre rankings on 3 & 6 month relative strength lists.
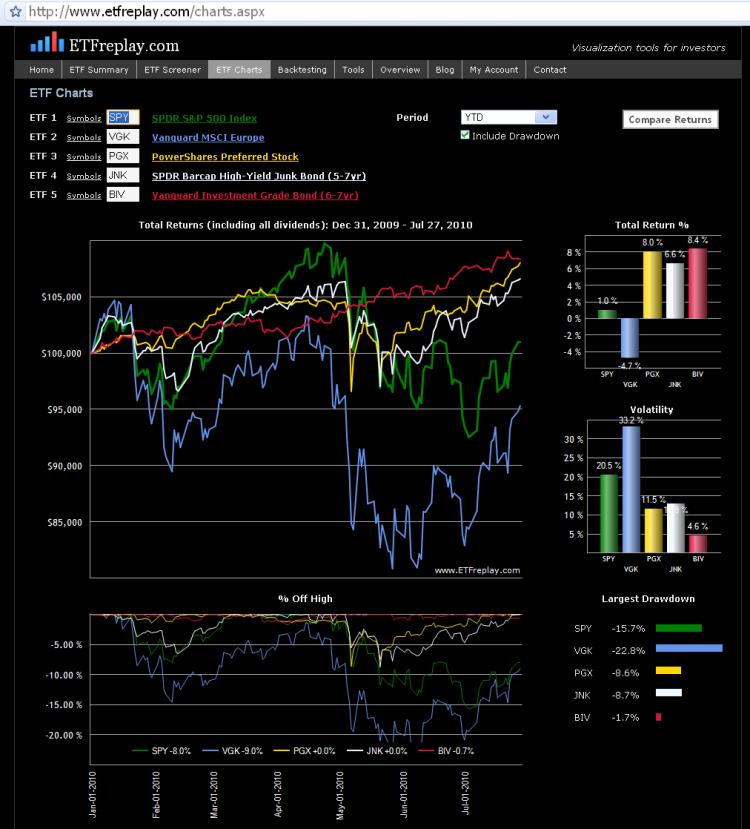
Another important item to point out is that owning bonds and yield-oriented hybrid securities (like those listed above) has been a LOWER volatility method to making money these past few months.
When the market gets volatile – as it does during corrections – buying inverse ETFs may seem like a good way to make money -- but remember, the Sharpe Ratio penalizes for volatility and you must expect large returns to offset taking on such rising volatility environments. Short-sellers have been punished hard this month while lower volatility funds (like those listed above) have appreciated.
In some respects, owning bonds -- particularly treasuries -- is a dominant method over shorting stocks. The volatilities are far lower if you keep your maturities reasonable. Thus you can express a bearish view without taking the same risk as you do during hard short-squeezes in equity markets.
We think it’s important to stay abreast of what the market itself is telling us through relative strength. When combined with your own fundamental ETF ideas, this market-generated information can be the key edge you have in terms of finding profitable entries and exits.
As we proceed further into the 2nd half of 2010, we have every intention of finding market segments that stay consistent with our global relative strength models. Near-term, look for pullbacks in some of the improving relative strength ETFs to make any adjustments necessary to your portfolios net exposures.
Jul 08, 2010
in Relative Strength
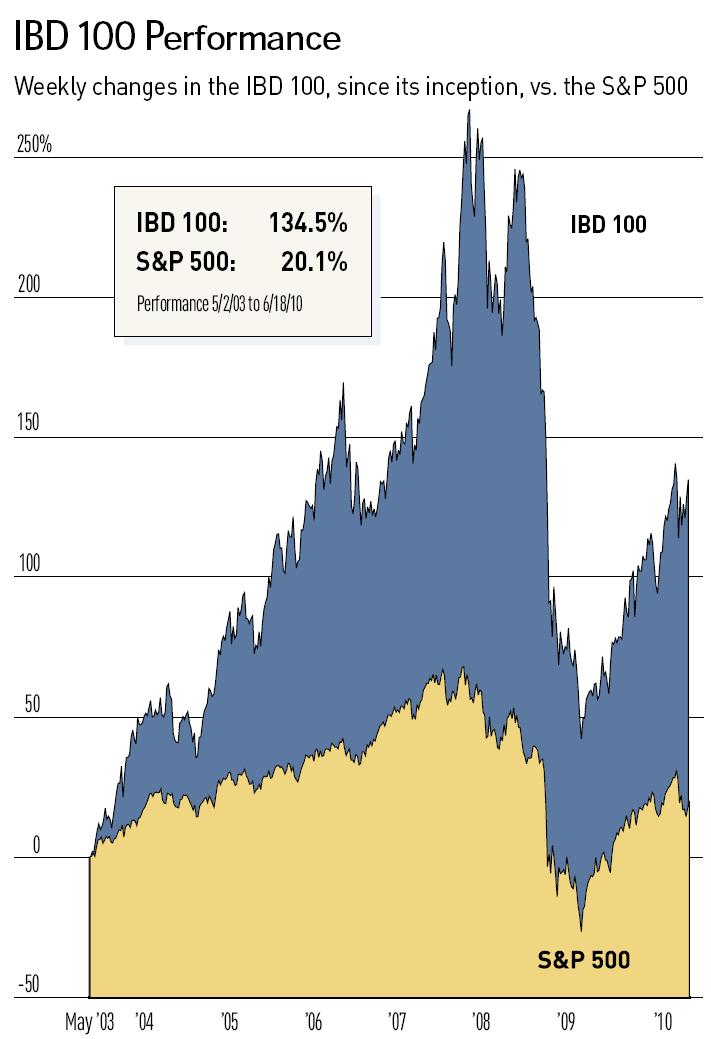
The Investors Business Daily (IBD) 100 is at its core a Relative Strength backtest of the IBD stock universe. Note that IBD's method is to also use its larger market BUY and SELL signals and these do not show up in the chart below.
If you use fixed-income ETFs in your ETFreplay screening / backtesting lists -- you effectively automate the 'Buy-Sell' signals by naturally rotating into the higher relative strength bond ETFs as stocks breakdown and bonds rally. We suggest using intermediate or short-term bond ETFs in your lists. Long-dated treasury ETFs can suffer from very high volatility -- and a key concept is to avoid highly volatile securities UNLESS they offer high expected returns. This is unlikely the case for most bond ETFs -- bond ETFs best attribute is their stability in times of turbulence.
Note also that while the IBD 100 is compared to the S&P 500 below, it does often own foreign stocks that trade on U.S. exchanges. While we cannot calculate the volatility of the IBD-100 since we don't have the data series, we suspect its volatility is far greater than the S&P 500. Remember that when volatility is HIGHER, you would EXPECT larger relative drawdowns.
This image captures the cumulative return of the IBD 100 index up through June 18, 2010 (note the massive drawdown in 2008).
May 27, 2010
in Relative Strength, Video
This video discusses some ideas related to our powerful Portfolio Relative Strength Backtest. The key to understanding how it works is to understand its relationship with the ETF screener
Comments and feedback appreciated.
Go to the Portfolio Relative Strength Backtest
Not a subscriber? Subscribe