Category: Moving Average
Mar 04, 2025
in Moving Average, Channel
We have added a 'Substitute' function to the ETF Moving Average and Channel backtests.
Clicking 'Substitute' allows subscribers to specify a different / replacement security for the actual trades. For instance, in the example below the backtest invests in QQQ when XLK is above its 12-month Exponential Moving Average (EMA).
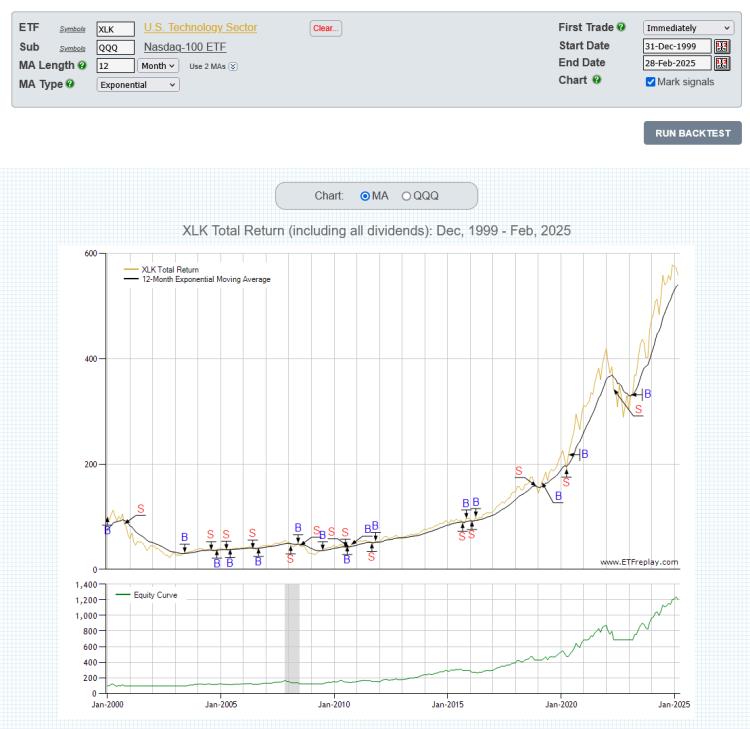
click chart images to view full size versions
The Substitute function is available to all subscribers on the following backtests:
Note:
To test investing in Portfolio A when x security is above its MA and Portfolio B when x security is below its MA, use the Regime Portfolios backtest.
Jun 20, 2024
in Moving Average, Dashboards, Timeline
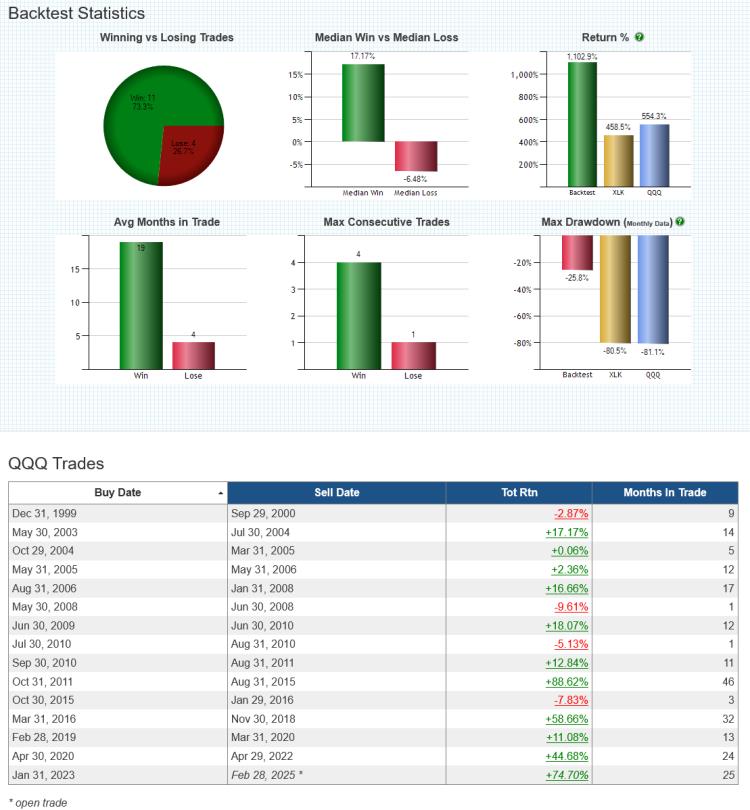
Q. "How can I check for moving average crossovers on the ETFs in my portfolio each month?”
A. To monitor a moving average model you can use either the Portfolio MA Timeline or set up a Dashboard.
click image to view full size version
While the Timeline’s main graphic displays the invested history of each security in the portfolio, the far right column of the data table shows how near / far each ETF currently is from the chosen MA. As it gets closer to the end of the month, this can be used to estimate the likely positions for the following month. Clicking on the percentage value in that column will produce a pop-up window that displays a chart of the ETF and its moving average.
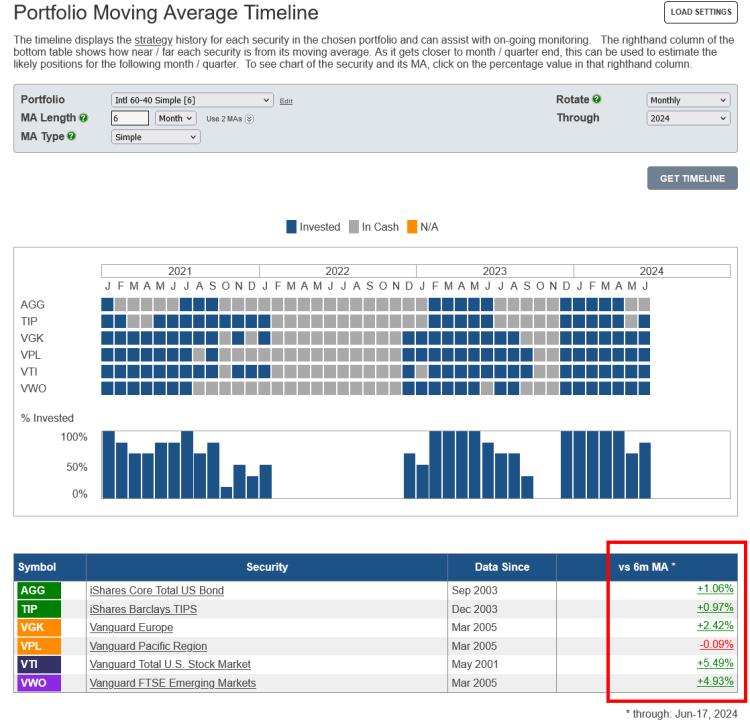
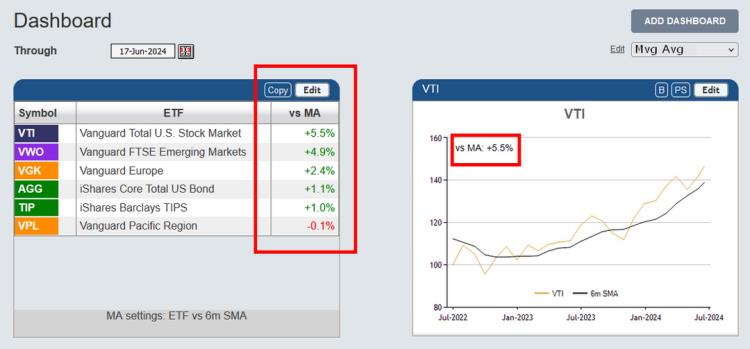
Alternatively, rather than using the Timeline, you can create a Dashboard and then add :
- MA List - displays the vs MA % for each ETF in your portfolio.
- MA Chart - vs MA % will be displayed on the chart
click image to view full size version
See: Introducing Dashboards: A Way To Help Organize Workflow In Research & ETF Portfolio Backtesting
Notes:
-
Moving Averages on ETFreplay are calculated using Total Return. i.e. the calculation does not just use closing prices but also accounts for the receipt and reinvestment of any dividends and distributions. The MA is then compared to the Total Return value of the ETF, so that it's like-vs-like; everything is Total Return, not just price. See the FAQ How are moving averages calculated?
-
Timelines are also available for Portfolio Ratio MA and Channel models.
Oct 20, 2022
in Moving Average, Channel
Trend following approaches, such as Moving Averages and Channels, preserve capital by cutting losses and as such they need sustained bear markets to outperform.
While they will generally capture the bulk of a bull market, the inherent lag means that a trend strategy can never sell at the high of an up move and can end up surrendering significant gains before exiting.
Consequently, outside of bear markets, the best they can do is to be fully invested and match the performance of the benchmark. However, bull market corrections and the short-lived directional moves of sideways markets mean that trend-following methods will inevitably suffer some whipsaw losses.
In other words, lengthy periods of underperformance should be expected in bull and range-bound markets. For those that can endure these mentally taxing and financially challenging periods, the pay off is the avoidance of major bear market drawdowns.
Below are a pair of backtests, a channel and a moving average, on a simple global 60/40 portfolio (VTI 35%, VGK 10%, VPL 10%, VWO 5%, AGG 30% and TIP 10%). Examination of the annual returns shows both the strengths and weaknesses of these trend following methods.
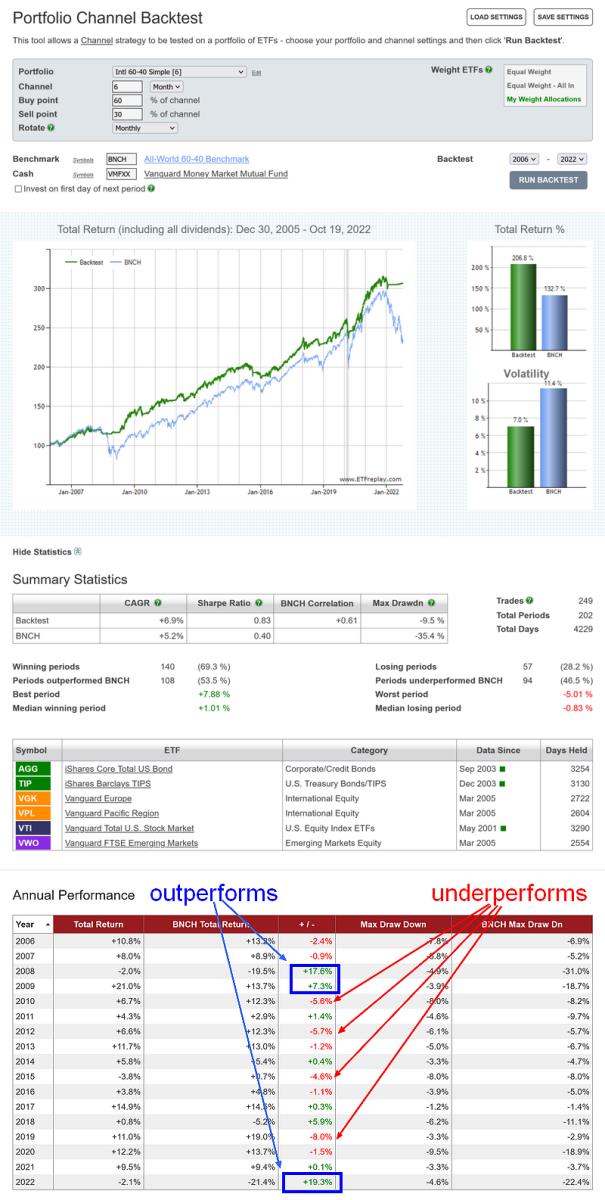
click image to view full size version
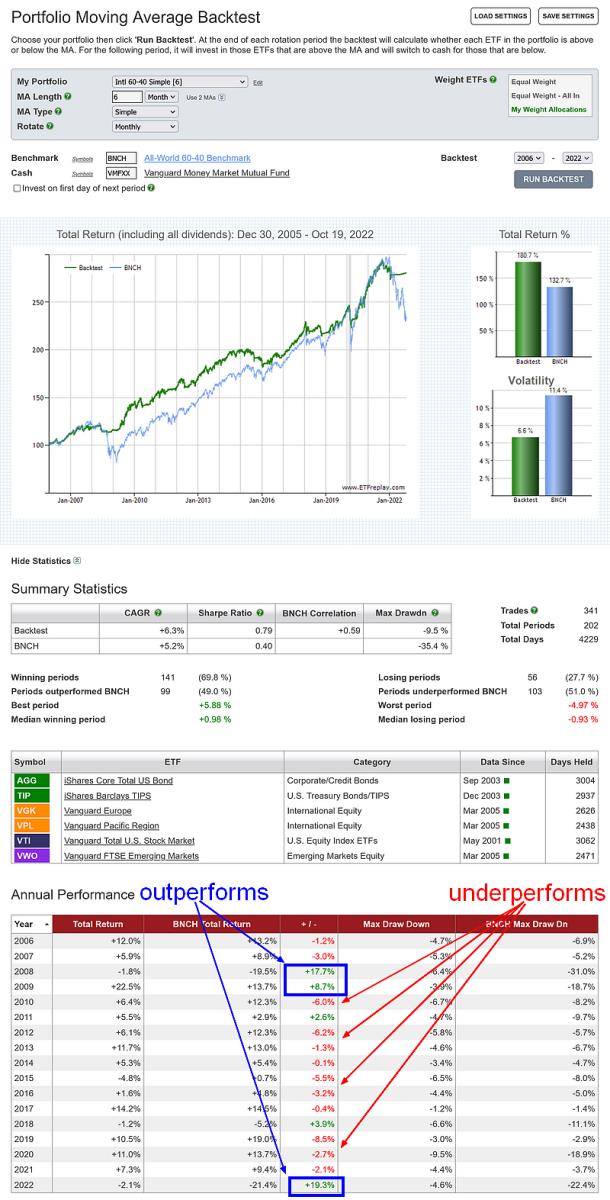
click image to view full size version
Portfolio Channel Backtest
Portfolio Moving Average Backtest
Aug 31, 2021
in Backtest, Moving Average, Channel, Ratio, Parameter Summary
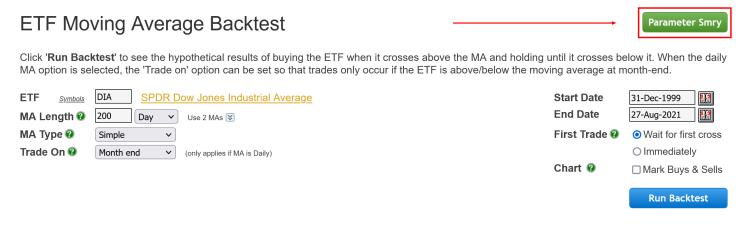
We have added three new Parameter Performance Summaries to the website:
As with the Relative Strength and TRD summaries that we introduced in July, each of the above can be accessed from their respective backtests.
Set the min, max and step / increment for each parameter, then click 'Run Backtests' and the tabulated results will be displayed:
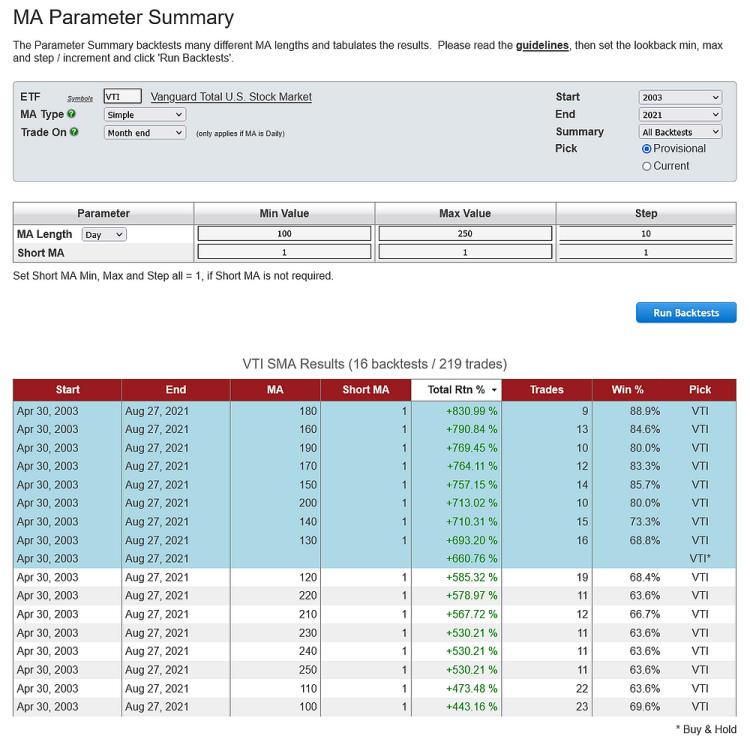
Parameter Performance Summaries are available to all (regular and pro) annual subscribers.
** studying the guidelines that we published within the original Parameter Summaries announcement is highly recommended **
Apr 30, 2018
in Relative Strength, Moving Average, Video
A video using ETFreplay Backtesting to look at some relative strength concepts and a moving average filter (daily).
to expand video on screen, click the '4 expanding arrows' icon in the bottom right corner of the video screen