Category: Total Return
Nov 03, 2025
in Total Return
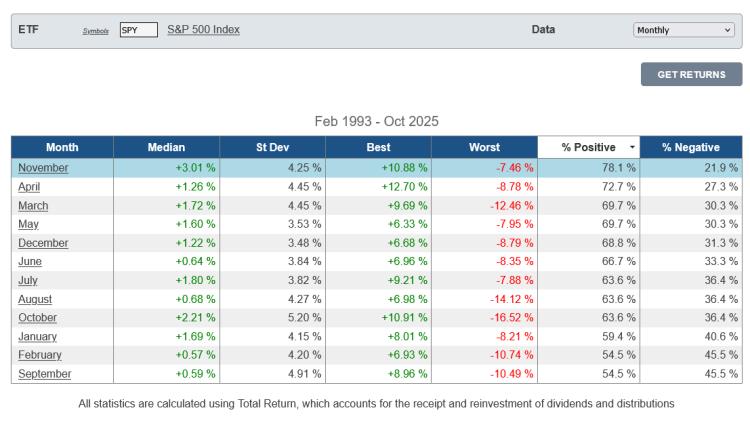
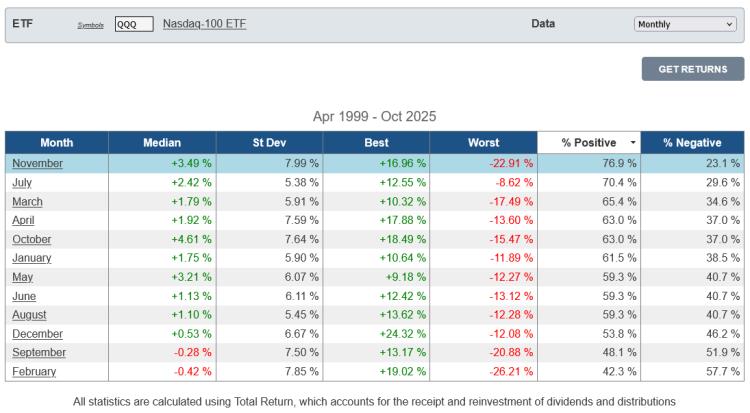
SPY returns have been positive more frequently in November than any other month of the year. Since its inception, SPY has produced a median return of 3% in November and been positive 78% of the time.
click image to view full size version
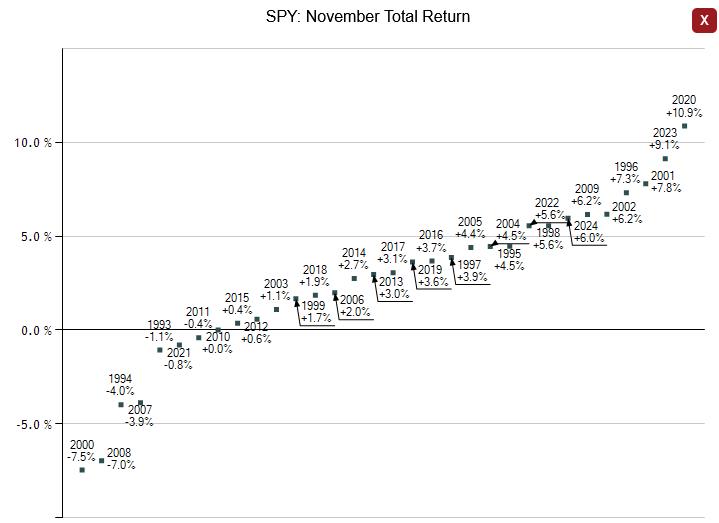
Its best November return so far has been +10.9% in 2020 and its worst -7.5% in 2000. 2021 was the last time it posted a negative return in November (-0.8%).
The first half of November has historically been stronger than the second half of the month for SPY; its median return for the first half of November is +2% and it’s been positive 75% of the time versus a median return of +1% with 71.9% positive for the second half.
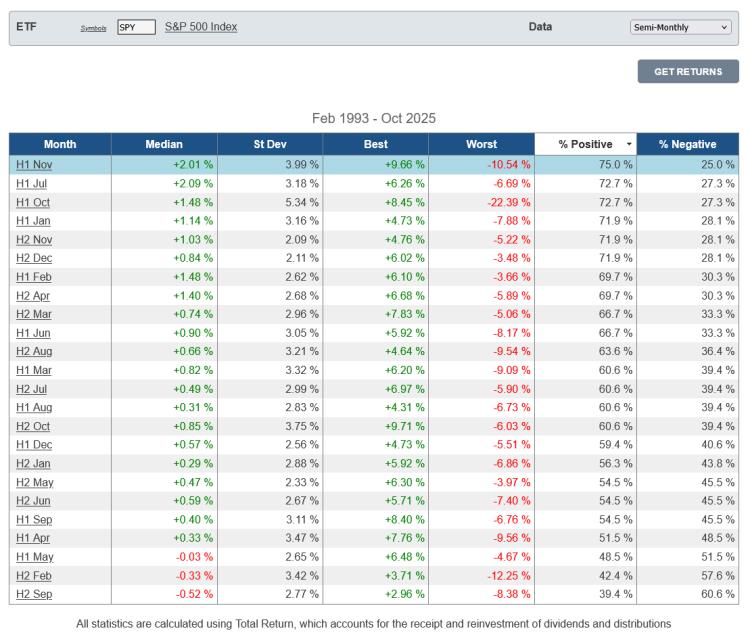
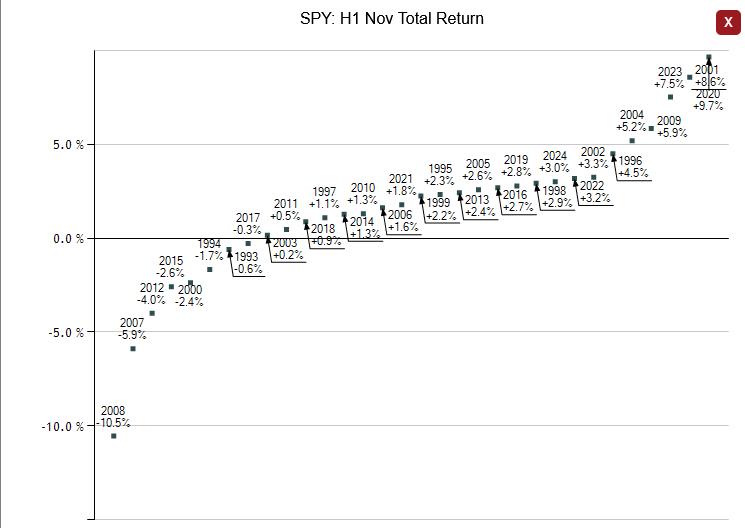
SPY’s worst first-half November return so far has been -10.5% in 2008. It last produced a negative return for the first half of November in 2015 (-2.6%). In 2015 the second half of November reversed the first half decline and SPY finished the month positive.
QQQ has also been positive more frequently in November than any other month, though it is also the month with the highest standard deviation.
click image to view full size version
Jan 01, 2024
in Total Return
The chart below displays the 2023 Total Return for a few different types of S&P 500 ETF (growth, value, market-cap weight, equal weight and low volatility):
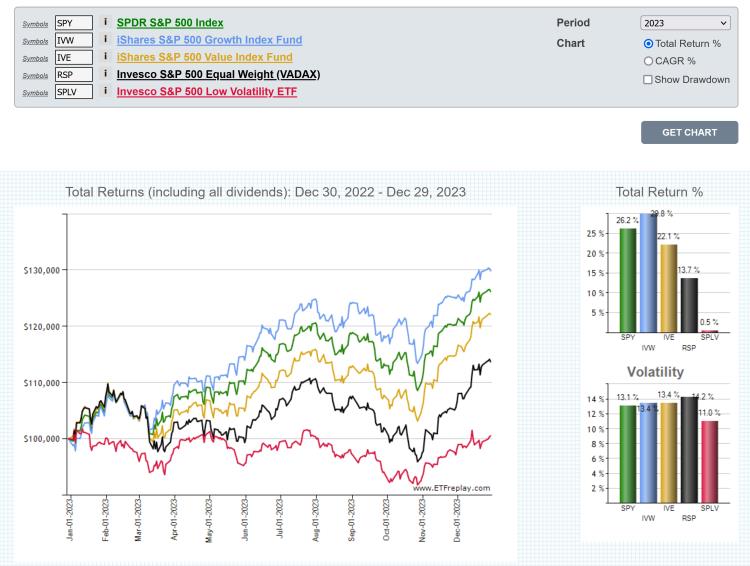
click image to view full size version or go to the chart page
To put the performance of the market-cap-weight S&P 500 into global perspective, the below chart and table shows 2023 Total Return of SPY alongside a selection of developed international and emerging market country funds.
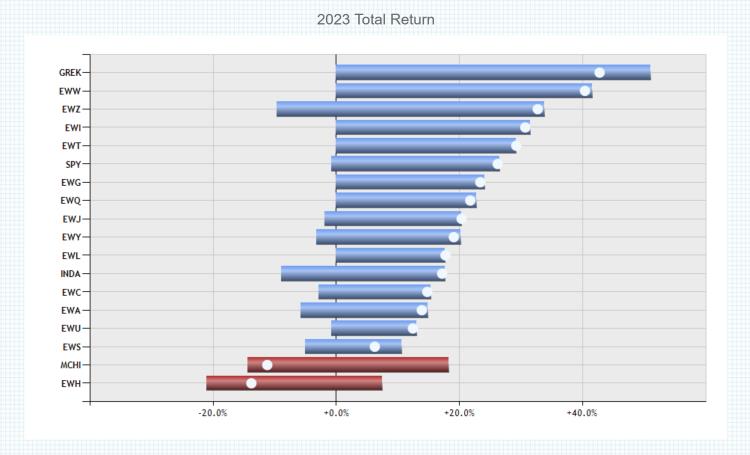
click image to view full size version
note:
Total Return accounts for price appreciation and the receipt and reinvestment of dividends (and any other distributions, such as capital gains distributions). See Total Return vs Price Return
Jan 03, 2023
in Total Return
2022 Total Return for the S&P-500 (both market-cap-weighted and equal-weight) and a selection of developed international and emerging market country funds.
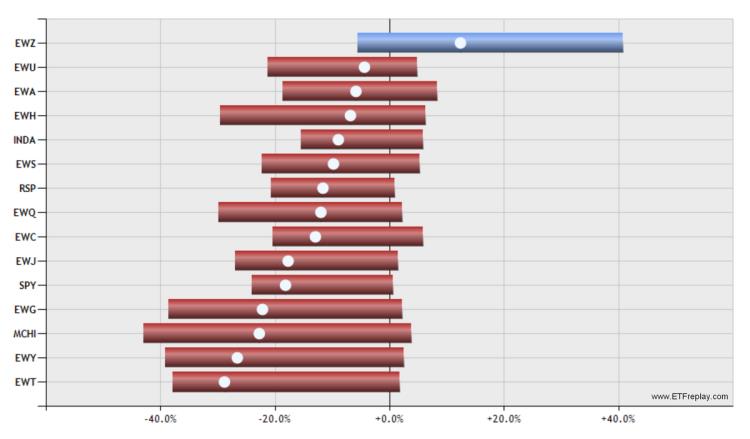
click image to view full size version
Sep 11, 2017
in Total Return
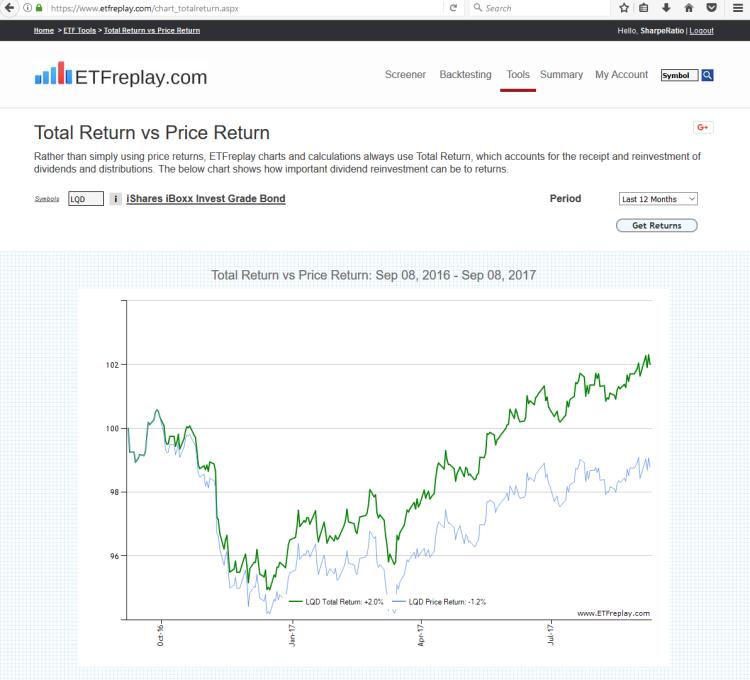
Does the ETF market price track the ETF's underlying index?
No. You must calculate the Total Return and use that resulting data series for accurate backtesting signals.
ETFs as you may be aware are designed to track an index. In order to have the ETF track the index in terms of a backtest, you need to re-vinvest the dividends and distributions paid. An 'index' of course doesn't make distributions since it is not an actual investment product. So the 'index price' actively builds the dividends back into the calculation of the index value (price). But ETFs don't do this, they must pay out distributions by SEC law.
Thus, only the CALCULATED total return data series can represent the INDEX PRICE (the ETF PRICE does not). If you just used the ETF price, you will get inaccurate signals. You can observe the difference between the price return and total return with our Total Return vs Price Return tool.
Jul 21, 2011
in Total Return
Total return is a concept that is surprisingly misunderstood. We get emails asking why does our moving average not match Yahoo or Tradestation?
Most Internet data sources and brokerage software platforms don't track total return -- yet total return is how all index returns are stated. In 2010, the SPDR S&P 500 index fund (SPY) was not +12.8%, it was up 15.1%. Vanguards investment grade bond fund (VCIT) was not +5.1% in 2010, it was +10.0% (and had some nice tactical swings throughout the year). The difference was distributions (which come in 2 forms: dividends and capital gains distributions).
One common thing we see is for various people to compare their performance to the price-only +12.8% and then footnote it saying 'dividends excluded'? To us, this is just as bad as mutual funds that claim the expense ratio is 1.2% and then footnote it saying you will be charged a 3% redemption fee if you sell the fund in first 5 years. There are no hidden fees with ETFs -- no sales loads, no purchase or redemption fees, no 12-b-1 fees. The 'A-class' 'B-class' 'C-Class' 'H-Class' 'I-class' mutual fund system is non-sensical in the ETF world --- there is only a single class of an ETF.
Here is another one: the Vanguard 60-40 stock-bond balanced fund returned +20.1% for the 10 years ended June 30th, 2011 [1]
[1] excludes dividends
Well, a large part of owning a bond in the first place is the coupon. As it turns out, that index fund (VBINX) was +59.7% INCLUDING dividends. So it is entirely disingenuous to compare to a number that is one-third of the actual index return.
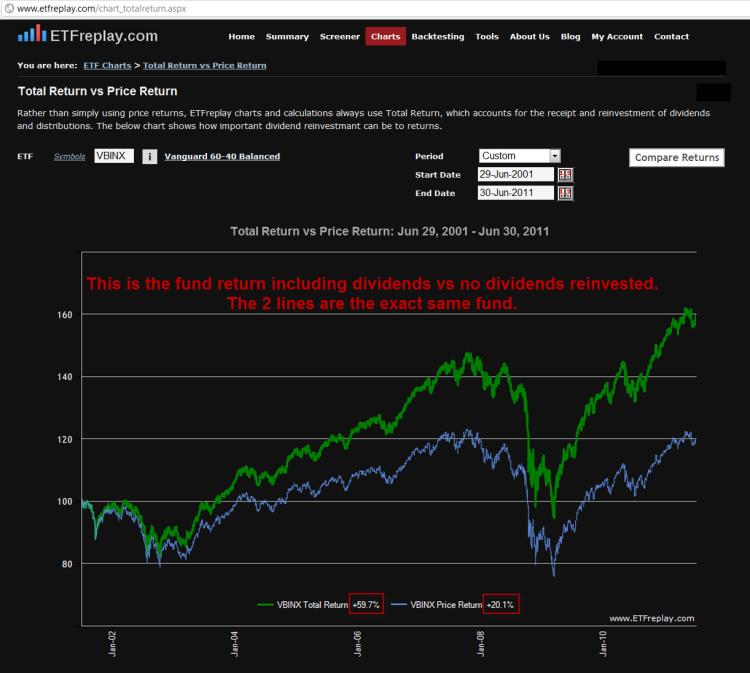
While this is all obvious to some -- it is clearly still not understood by many.
We created a free Comparison Tool to make it easy to view this concept as we feel the only REAL way to truly understand something fully is to interact with it through an application -- rather than just read about in a paper or on a blog.
Try a few out. Be aware that even if its not a large dividend payer, any capital gains distribution will also affect the return.
Bond ETFs:
Others: