Sep 27, 2017
in Drawdown
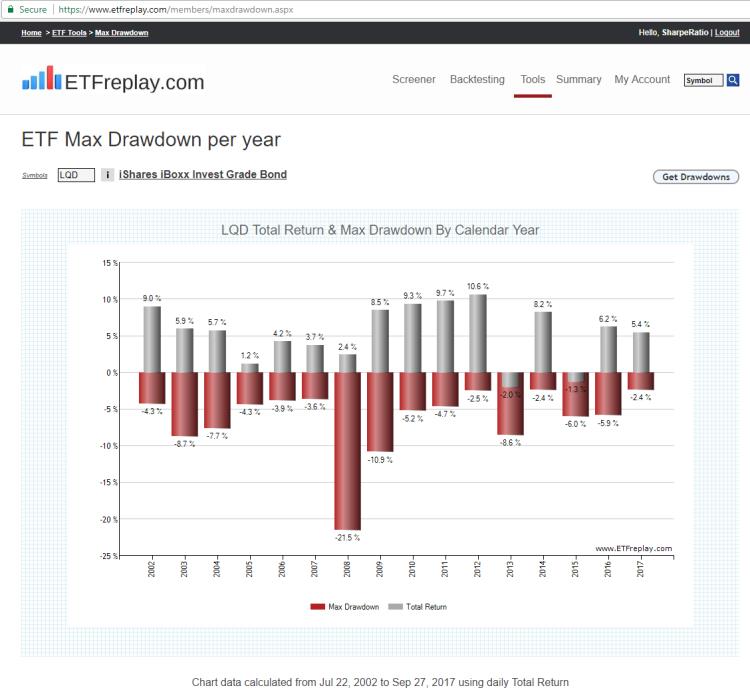
Over the past ~15 years, the bond market has generally had positive single-digit returns and also single-digit calendar year drawdowns. As the gentlemens asset class, bond ETFs generally don't have the anguish associated with the big drawdowns of many equity ETFs.
For a reference point, below is a snapshot of Calendar Year returns and drawdowns for LQD, an investment grade bond ETF:
What is remarkable about this year is the combination of high returns with extremely low drawdown in some traditionally high-vol, high-drawdown segments - such as emerging markets. 2017's max drawdown for emerging markets has actually been less than most BOND market years.
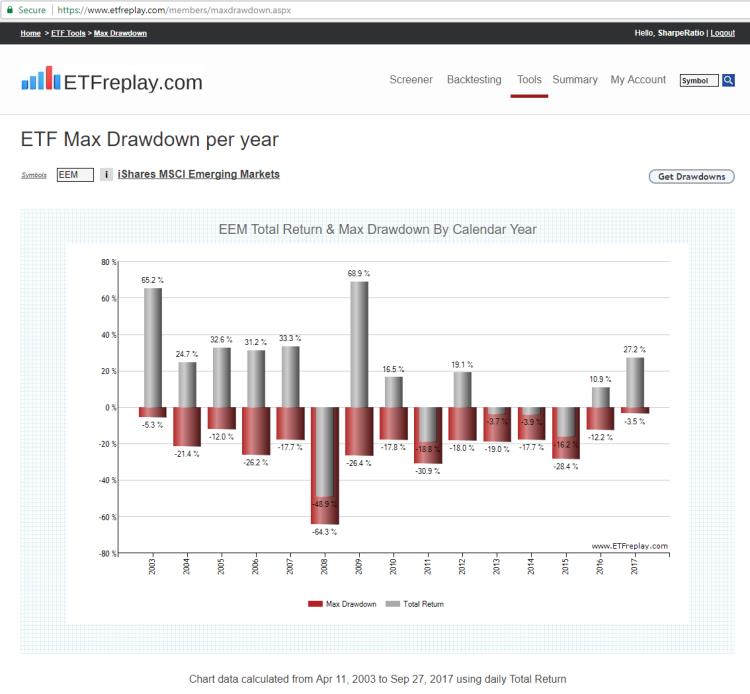
+27% YTD total return near the end of the 3rd quarter of 2017 vs just -3.5% drawdown. Obviously, strong return and Low volatility leads to high rankings in our Relative Strength models. Uptrends can have some violent short-lived corrections but investors can manage such volatility by tilting their portfolios away from the weakest segments.
Link to the tool in this blog (subscribers): ETF Max Drawdown
Sep 11, 2017
in Total Return
Does the ETF market price track the ETF's underlying index?
No. You must calculate the Total Return and use that resulting data series for accurate backtesting signals.
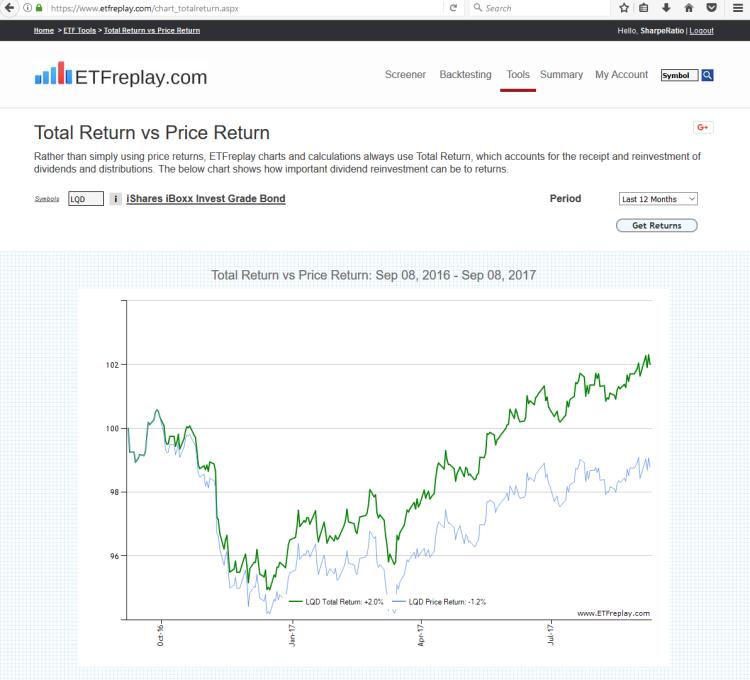
ETFs as you may be aware are designed to track an index. In order to have the ETF track the index in terms of a backtest, you need to re-vinvest the dividends and distributions paid. An 'index' of course doesn't make distributions since it is not an actual investment product. So the 'index price' actively builds the dividends back into the calculation of the index value (price). But ETFs don't do this, they must pay out distributions by SEC law.
Thus, only the CALCULATED total return data series can represent the INDEX PRICE (the ETF PRICE does not). If you just used the ETF price, you will get inaccurate signals. You can observe the difference between the price return and total return with our Total Return vs Price Return tool.
Aug 29, 2017
in Trend Quadrants, Sectors
Let's look back to 2016 and the market environment in the lead-up to the U.S. presidential election. What were the market conditions telling you?
Is the market moving TOWARD higher-beta, risky, higher-return-but-more-volatile assets? Or is it moving AWAY from those and into lower volatility, lower risk, safer assets? This is what actually matters.
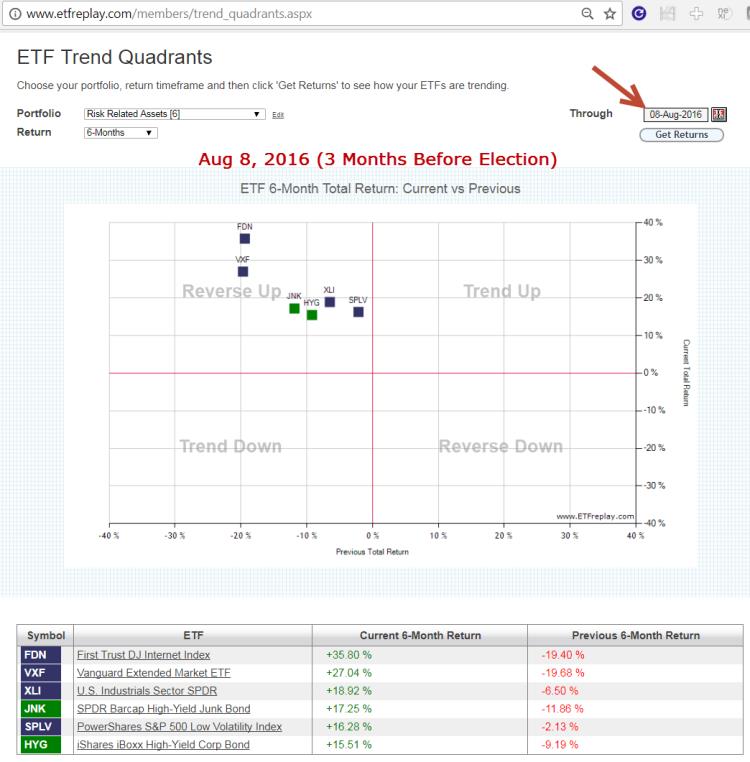
If you take a snapshot of the market 3 months prior to the election, you can see various risky assets in 'Reverse Up' position. That is, their 6-month returns were up while the previous 6 months had been down. We can view this on our ETF Trend Quadrants module (located on the ETF Tools page):
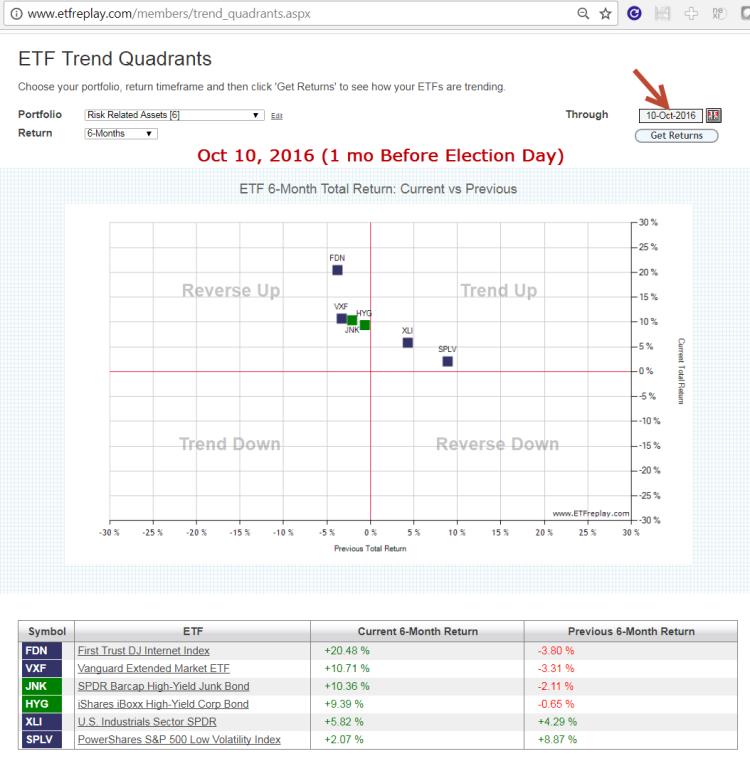
Here is the position 1 month prior to Election Day. Note ETFs here are moving to the right. This represents money flows IN.
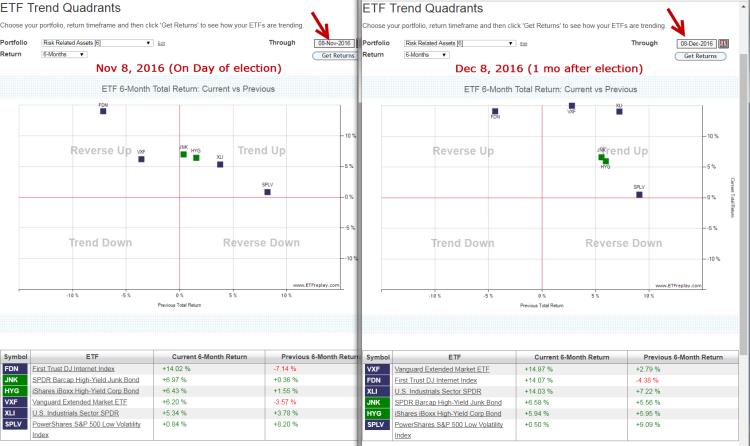
And then we align 2 browser windows to show Election Day and 1 month after:
Let's also cross-reference this thesis by looking at the credit markets, High-yield bonds vs Treasuries in ratio moving average form:
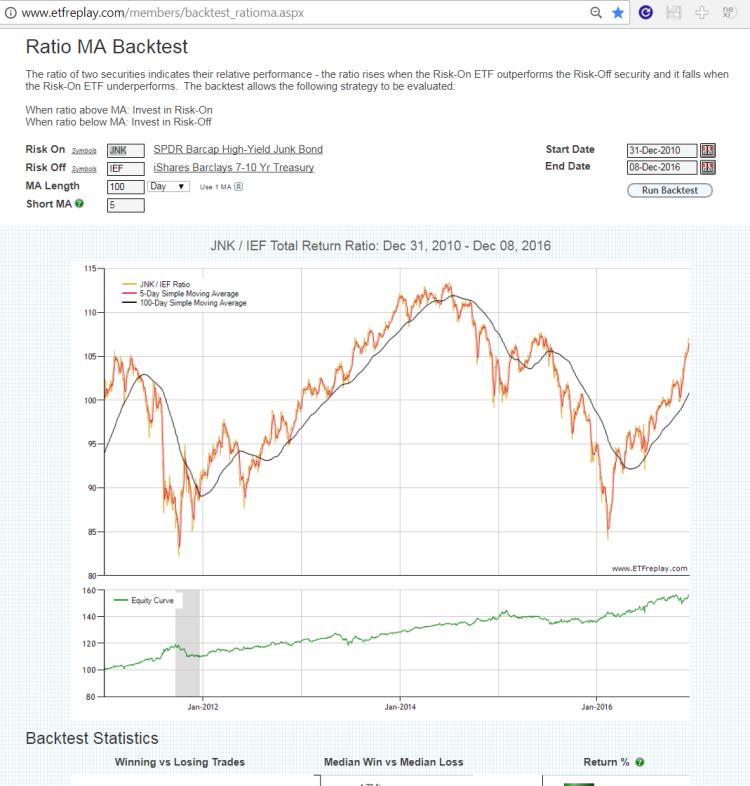
From 2014 into early 2016, high-yield bonds had under-performed treasuries materially. But a sharp V-spike reversal occurred in this ratio in early 2016. It was not unreasonable to think a new period of risk-on was possible if not likely given the 2014-16 relative drawdown.
The point of all this is NOT that these ETFs predicted the election. They didn't. The point is that the market conditions were bullish and this was visible in looking at the many intra-market relationships via ETFs. Sometimes the markets will whipsaw around in a tricky trading range -- but often times the markets follow the flows and 2016-17 is a real nice example of this.
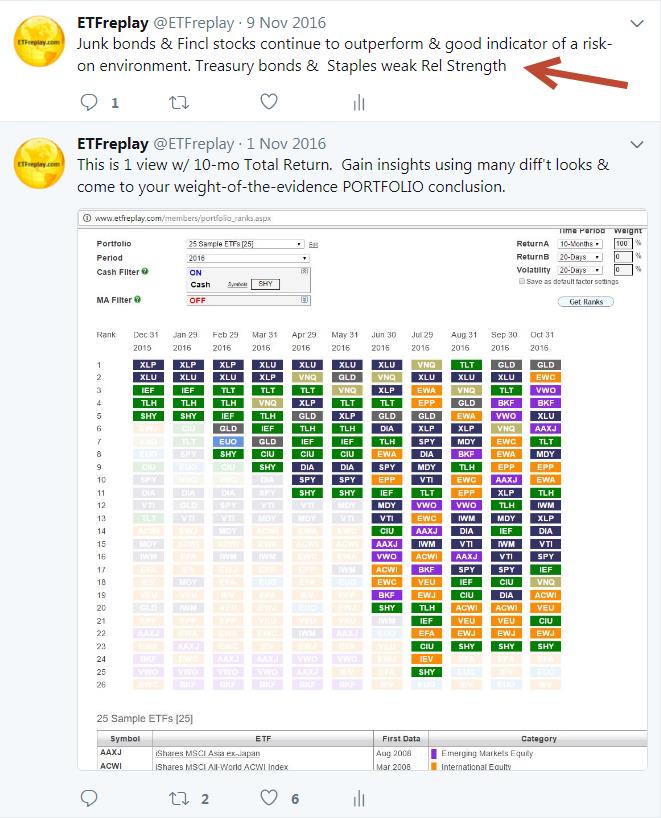
Our Twitter feed on November 9, 2016 made this point as well:
Jun 29, 2017
in Backtest
We have added a new backtest rotation option, which we think delivers some useful flexibility.
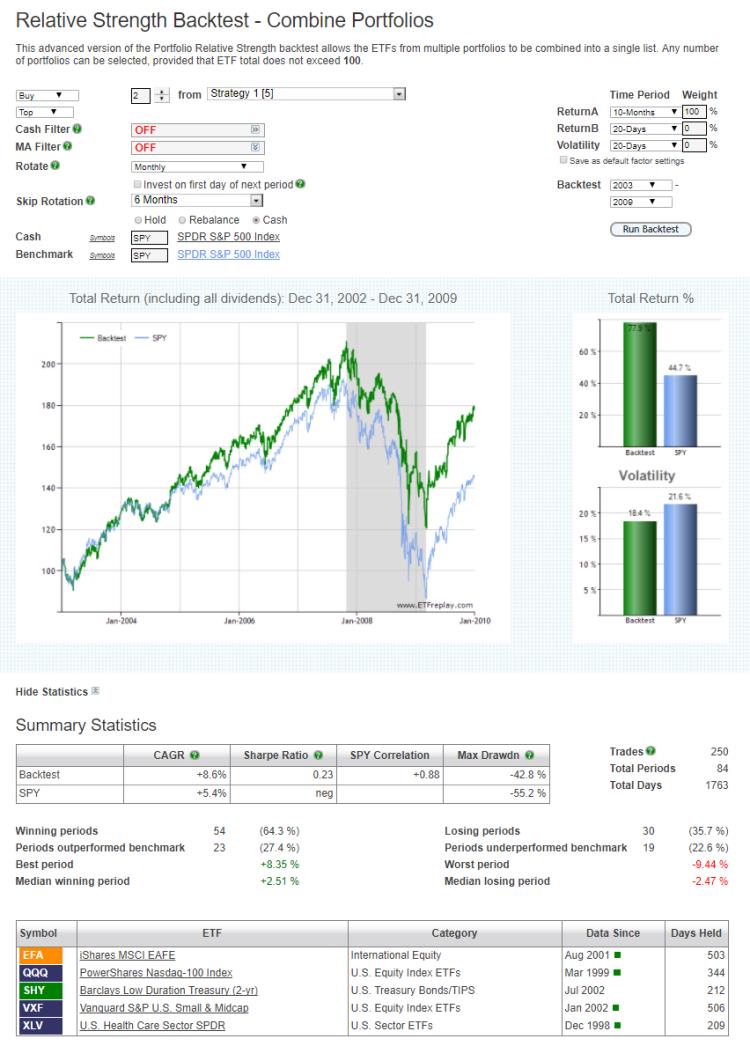
Previously Relative Strength strategies could be rotated quarterly, monthly or semi-monthly. Now you can choose a different schedule in the 'Relative Strength - Combine Portfolios' backtest module utilizing a useful feature we call Skip Rotation:
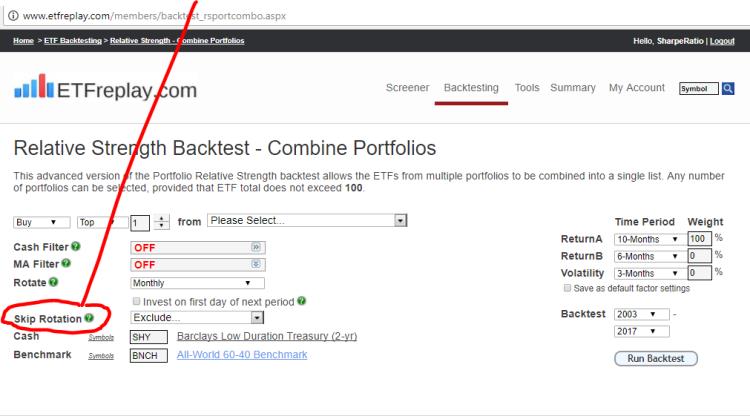
This way you can set for example a 3-month (quarterly) or a semi-annual rotation but not necessarily on CALENDAR quarter ends. So for example, you could offset a quarterly rotation by 1 month and choose Jan, Apr, Jul, Oct. Or you could choose 'every other month' such as in the example below:
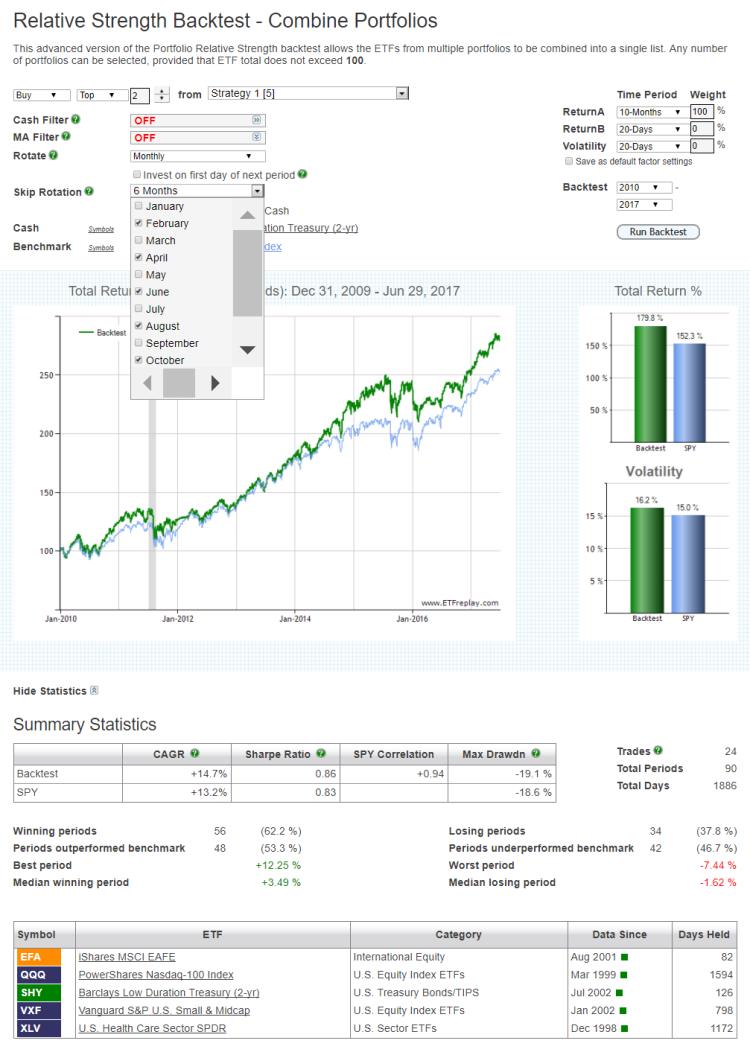
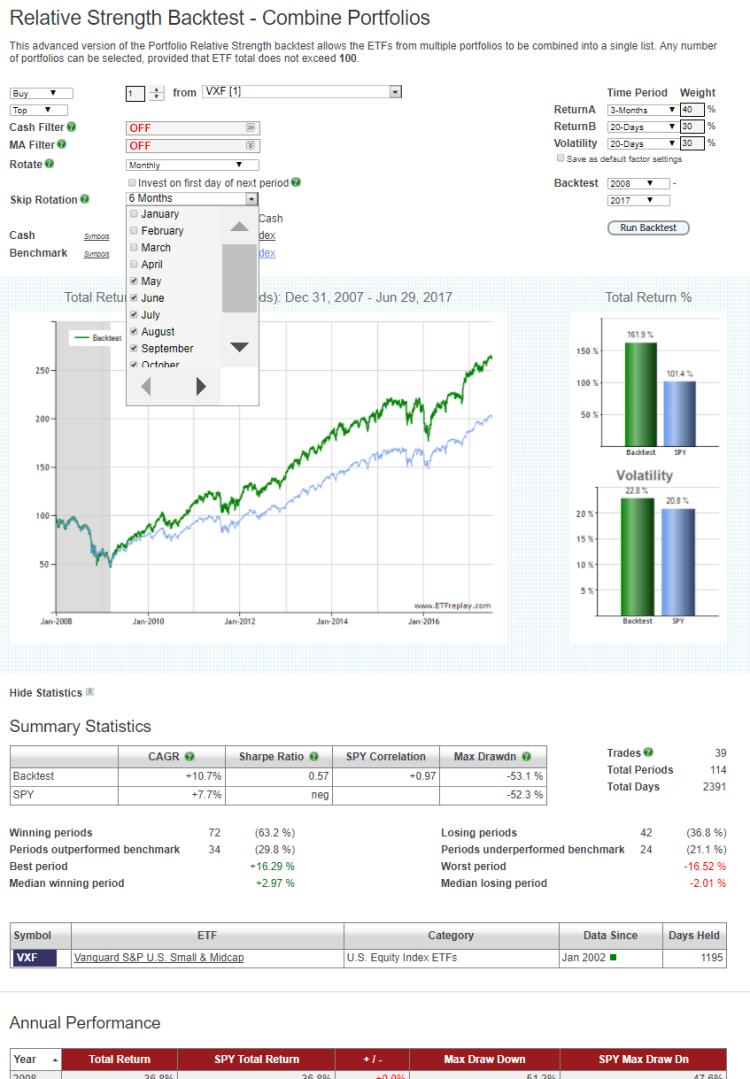
Then below we reverse it so now it skips the opposite months as the above example and instead test an earlier 7-year period:
Separately, we can actually use this same structure to do some basic seasonality testing. In the test below, we test going long Small and Midcap stocks for the period November to April and then invest simply in the benchmark S&P-500 from May to the end of October. We do this by using checkmarks to move to the cash security (set to SPY) for May, June, July, Aug, Sep and Oct:
The green question mark icon next to 'Skip Rotation' will, when clicked, produce a pop-up help note with more information about the function. However, if you have any further questions, please contact us.
Jan 23, 2017
in Regime Change, Ratio
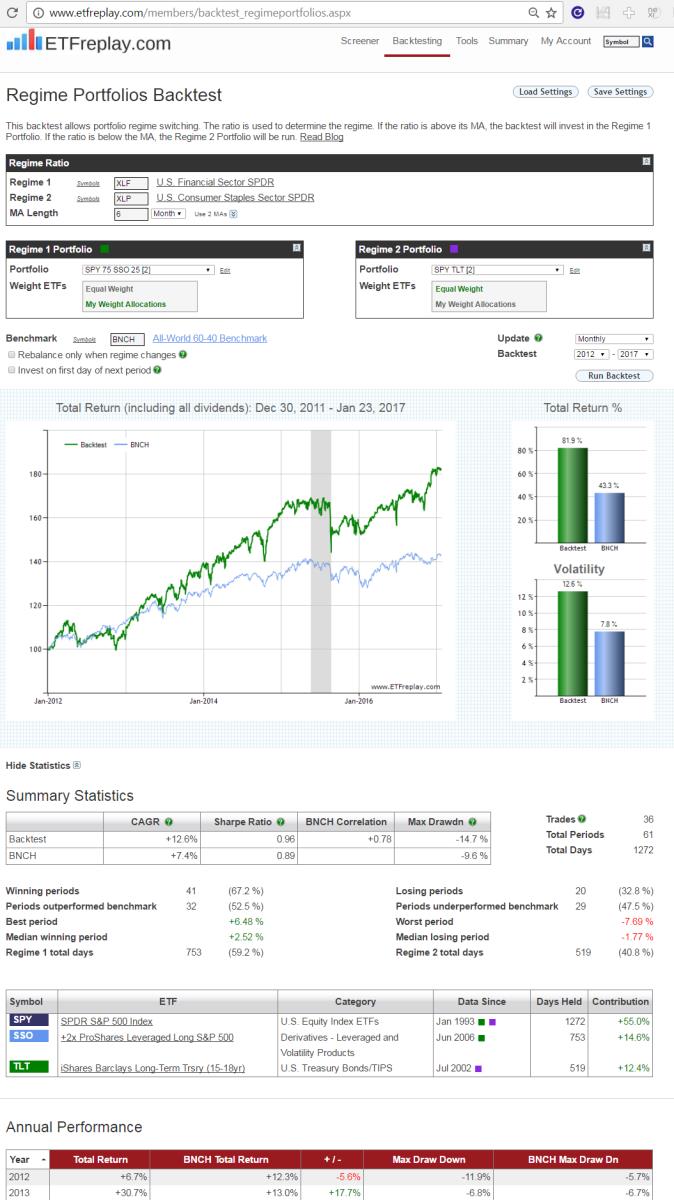
Last month we did a blog post on using high-yield bonds as a key indicator. This month we continue with a focus of using financial stock ETFs as a second indicator.
Many people seem to want to try to simplify everything down to one variable -- often something like a P/E ratio or a moving average. We think investors should look at a range of important indicators and then take a weight-of-the-evidence approach. Indeed, we built ETFreplay.com so that you can easily run and update a list of strategies AND do this on a continuous basis and thereby stay in tune with the overall structure of the market.
There is no better information than that which the market itself generates. A good market participant will learn to read what the market structure is telling you by analyzing its intermarket relationsihps.
Financial companies have business models that make our economy go. From mortgages and credit cards for individuals to bank loans and payment services for corporations, financial companies are absolutely vital indicators on overall conditions and this is why these companies are regulated closely by government agencies.
It makes sense that when financial stocks are doing well, how bad can the market environment be?? Look back at past recessions and you will see very poor performance of financial stocks.
The backtest below is meant as an INDICATOR -- not a strategy to implement per se.
When financial stocks are beating a known risk-off stable segment like US Consumer Staples, we will bring our portfolio Beta up above 1.00 by adding a 25% position in SSO (the 2x S&P 500 ETF).
When financial stocks are underperforming, we will split our holdings into 50% SPY and 50% TLT. This is the 'risk-off' portfolio. (Note that in this example -- no matter which regime is in play, the portfolio will hold at LEAST 50% SPY -- think of that as the 'core' portfolio and the other 50% as the 'satellite').
Here are the results. Make sure to dive-in and immerse yourself in this topic. Alter the time periods incrementally. Alter the risk-on risk-off portfolios. Study sub-period backtests. What are the good aspects to this backtest? What are the possible limitations?