Category: Regime Change
Oct 14, 2020
in Regime Change
This model is simple yet addresses an important issue for those that want to compete against a benchmark.
In order to compete against a specific benchmark, it makes sense to understand that benchmark. If you totally ignore it, you can do great but at times you will probably get frustrated because your strategy is totally out of sync.
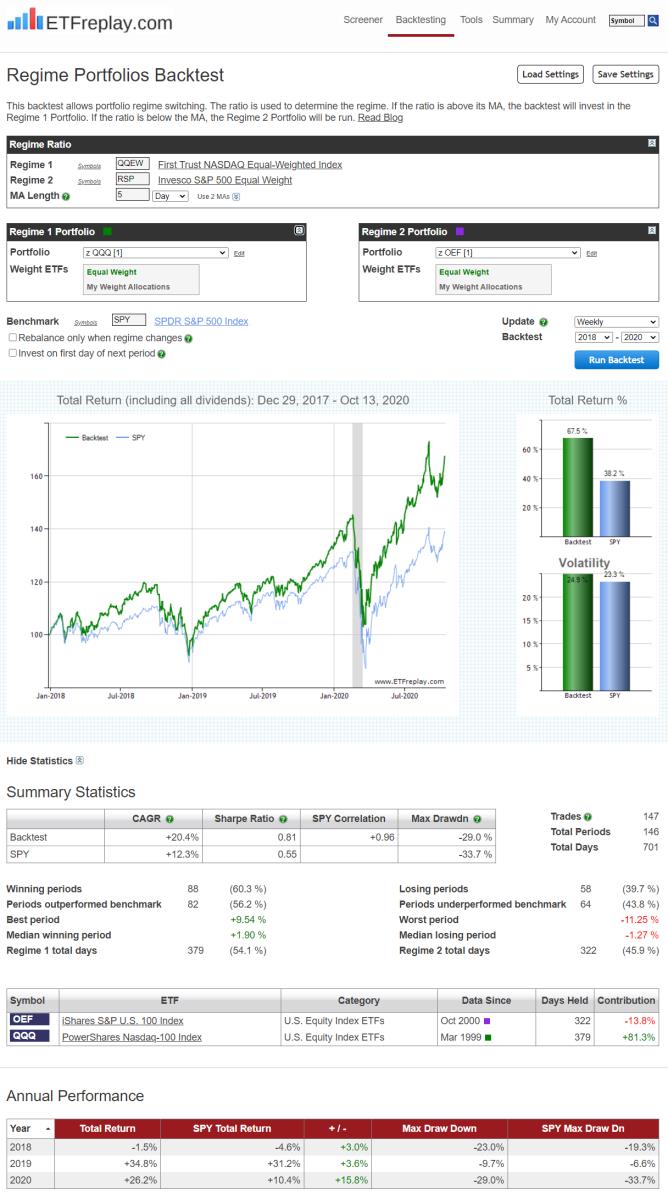
So take the example of a logical model of S&P Equal Weight vs NASDAQ Equal Weight. This is a pretty good indicator but at the same time, the S&P Equal Weight is wildly different portfolio than the weighted S&P because of the fact that market weight S&P is strongly skewed to the big, very profitable money-making S&P names (AAPL, AMZN, MSFT etc).
This backtest addresses that by using our Regime model. It still uses S&P EW vs NASDAQ EW as its indicator -- but then when it comes to actually buying and selling, it uses market cap weighted QQQ and market cap weighted OEF (S&P 100).
Take a look;

Jun 10, 2020
in Mean Reversion, Regime Change
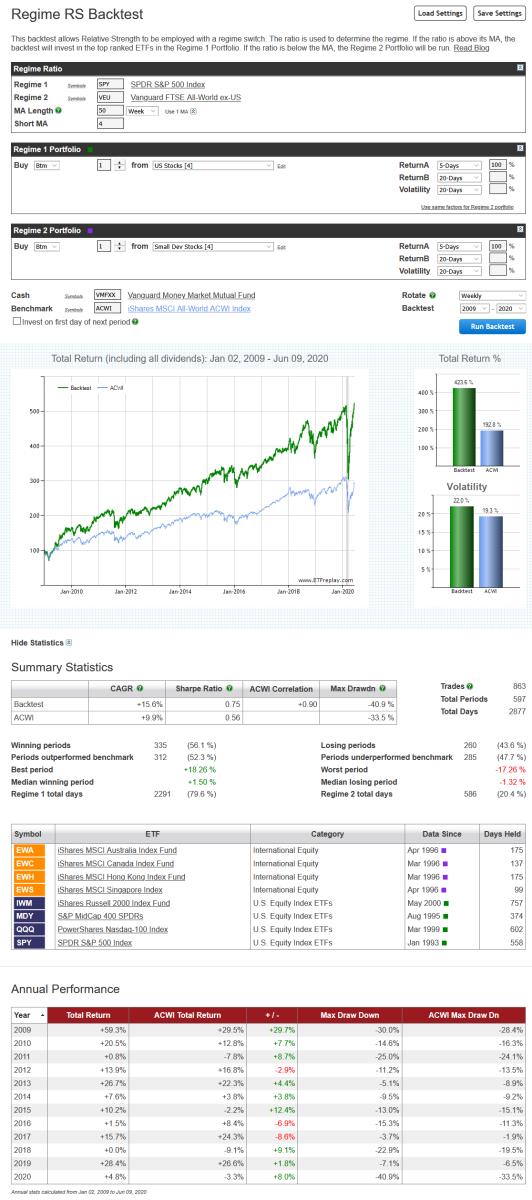
Late last year we produced a video that showed how two different strategies, relative strength and mean reversion, could be layered on top of each other. That example went through each of the constituent backtests separately, in order to explain the mechanics of the process.
The example below shows how such a dual-layered strategy can be run in a single backtest. The first layer employs the SPY / VEU ratio moving average as a regime switch to dynamically alternate between whichever is stronger; U.S. or International stocks. Then, the second layer picks the weakest short-term performer within that chosen asset class.
To keep it simple, we have used the same basic U.S. (MDY, IWM, SPY and QQQ) and international (EWA, EWC, EWH and EWS) ETFs that we have used in previous examples.

May 07, 2019
in Regime Change
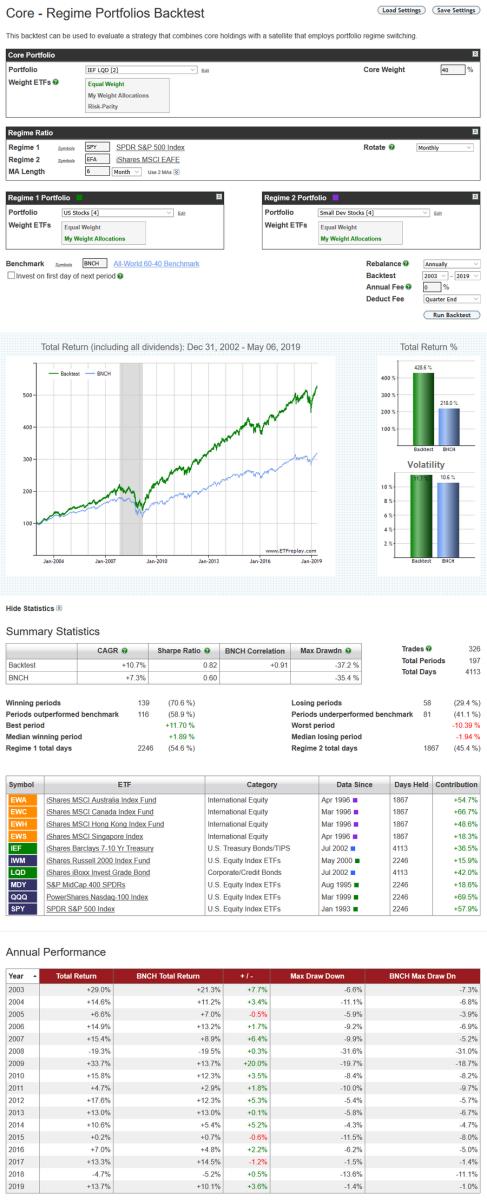
Back in 2010 we created our first multiple strategy module, the Advanced Relative Strength backtest, allowing subscribers to combine together different models into an overall portfolio. To illustrate the backtest, we produced a simple example that employed two sub-strategies; a basic US equity model (MDY, IWM, SPY and QQQ) and an international model using smaller developed country funds (EWA, EWC, EWH and EWS).
The example below uses the same ETFs as that original illustration, but this time, rather than running each model concurrently, we have employed the SPY / EFA ratio moving average as a regime switch to dynamically alternate between the two portfolios. When the SPY / EFA ratio is trending upwards (i.e. above its MA), the backtest invests in the US equity portfolio. When the opposite is true, it switches to the International stock portfolio. This regime approach is then mixed with a solid fixed income core portfolio (IEF and LQD) to form an annually rebalanced 60-40 strategy.

The Core-Regime Portfolios backtest is available to pro subscription members.
Apr 24, 2019
in Regime Change
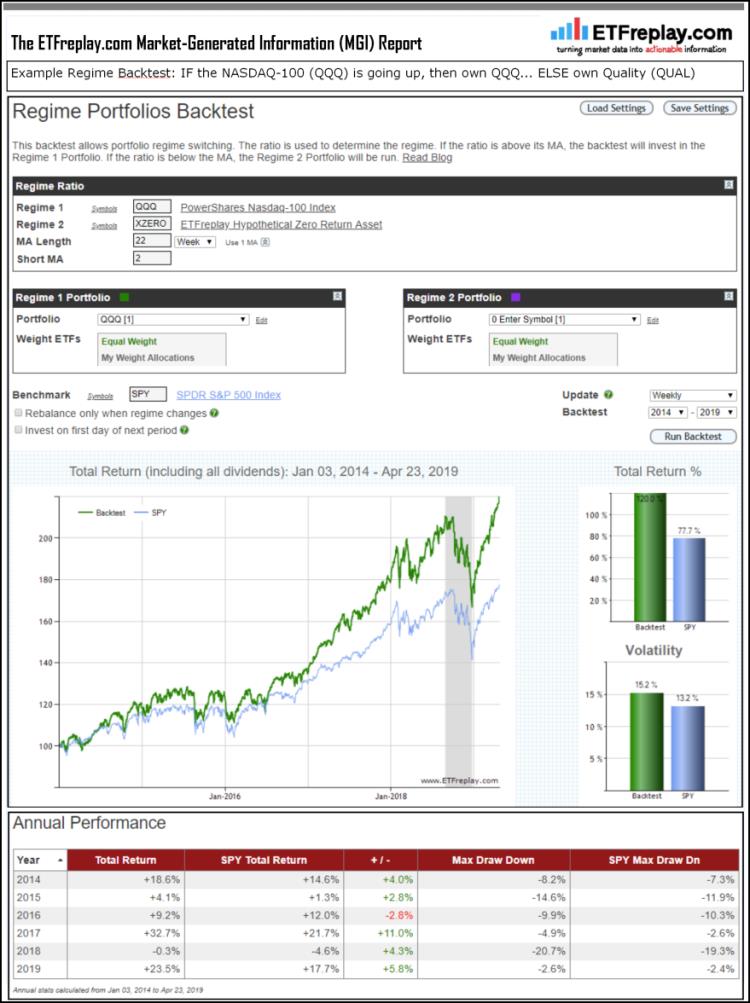
Regime Change is used in finance to describe when a condition changes. IF [condition1] is met, THEN invest in [X]... ELSE invest in [Y]. ETFs allow us to easily test conditions which are defined not by some calculation you've created to simulate an index, these are publicly traded securities with real money invested in them. There is no ambiguity as to the rules when you use real-world securities as is so often the case with non-financial regime tests.
Here is a simple example to get the hang of it, is the NASDAQ-100 going up? If it is, buy it. If it isn't, invest in a different type of ETF. In this example, the different type of ETF is defined by the QUALITY FACTOR. Quality stocks are those with strong balance sheets, lower earnings variability & higher Return On Equity -- as ranked by indexing firm MSCI. QUAL actually owned real stocks on each day with real money, we aren't subjectively now determining what should be classified as quality and what shouldn't.
What does the performance report look like for this idea? See below for summary version of an ETFreplay.com backtest report (statistical analysis excluded in image below).
Then try other ideas. All of your ideas don't have to work for you to be very successful at this. Indeed, this strategy has underfperformed its benchmark 46% of the time in last 5 years (as measured by relative performance in each calendar month). Yet the outperformance over time has been good.

Jul 26, 2018
in Relative Strength, Regime Change, Video
A video with a demonstration of the new Core-Regime RS Backtest module. The public video below uses the following subscriber-only backtest ETFreplay Core - Regime Relative Strength Backtest
to expand video on screen, click the ' 4 expanding arrows' icon in the bottom right corner of the video screen