Jan 31, 2012
in Relative Strength
Q. "How do I test a strategy that combines a core portfolio with the top relative strength ETFs from one or two satellite portfolios?"
A. Create your chosen portfolios
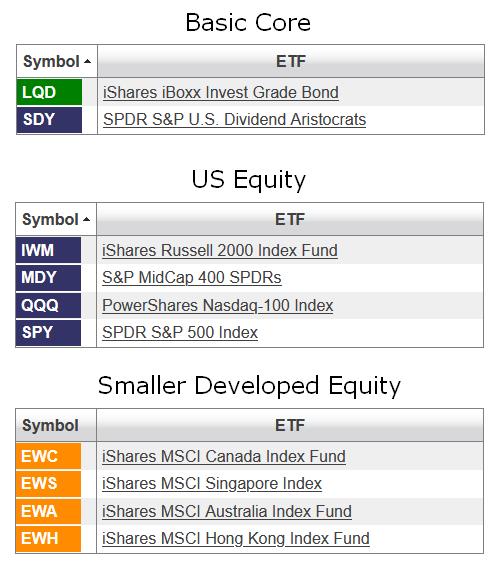
Go to the Core-Satellite Backtest, select your portfolios and choose your settings.
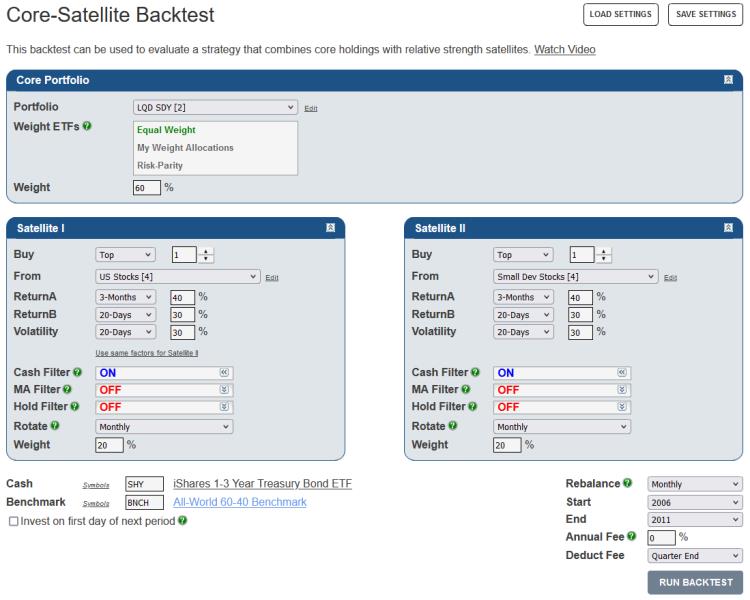
With the 'Cash Filter' ON, the top ETF must be ranked above the cash ETF (SHY), otherwise the backtest will switch to that cash security.
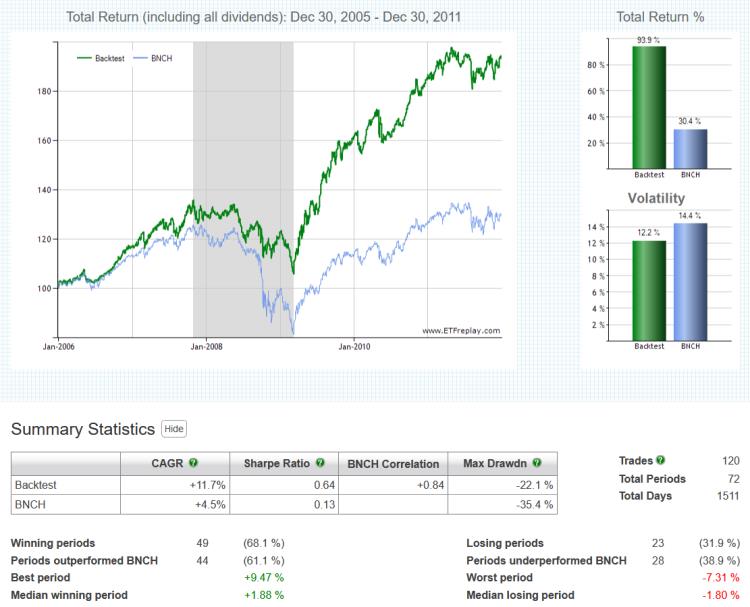
Click 'Run Backtest' and view the charts and summary statistics.
The 'Backtest Trade History' table displays the dates of all trades (entry and exit) and the performance of both the backtest and benchmark.
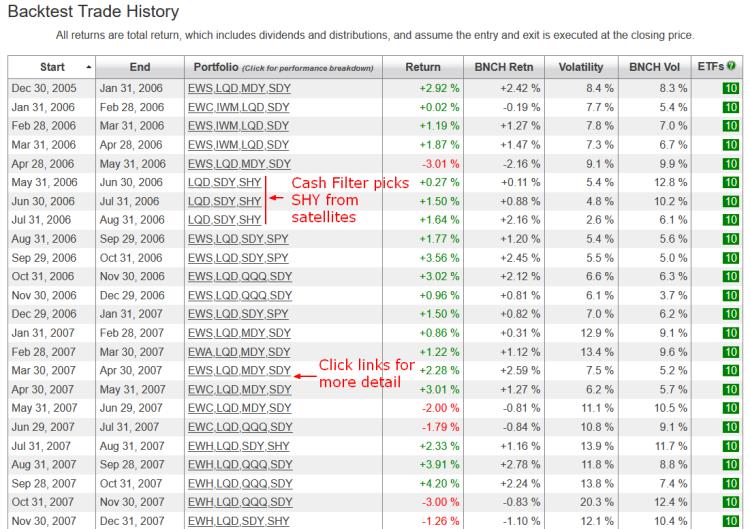
Click on the ticker symbols in the 'Portfolio' column of the 'Backtest Trade History' table for any period and a pop-up window will appear displaying the starting weight of each security and its return contribution
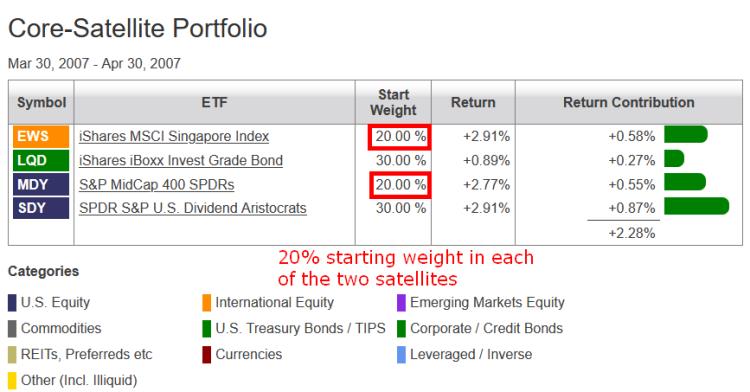
Please note that this is purely an illustrative example of one way to use the Core-Satellite backtest and in no way does it constitute investment advice. The portfolios were chosen for information purposes only.
Dec 22, 2011
in Drawdown, Volatility
We are updating our 'Volatility vs Subsequent Drawdown' Chart for 2011. We did a similar post a year ago and you can review that blog post here: Understanding ETF Volatility Part 1.
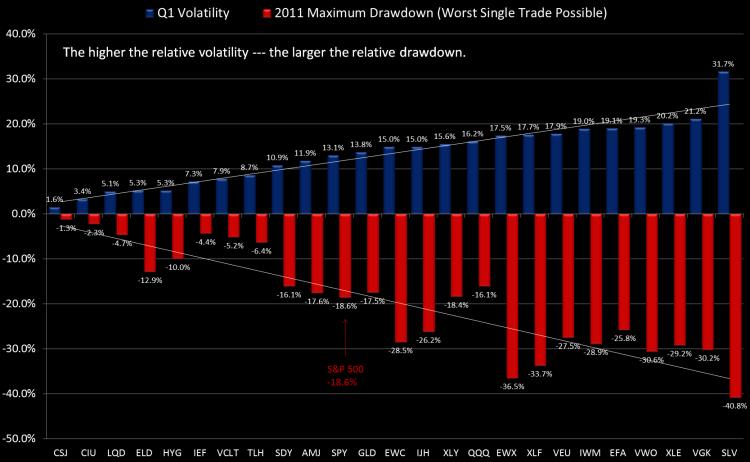
The way to read these charts is to simply note the relationship. By definition, high standard deviation investments offer wider opportunities for both out and underperformance. The S&P 500 dropped -18.6% off its high during 2011 (using closing total return values). This was -3.2% worse than the mid-year loss in 2010, when the S&P dropped -15.6%.
Gold had a more normal drawdown in 2011 at -17.5% vs 2010's -7.8%, due mostly to its more aggressive slope up during the summer. Gold never got particularly volatile in 2010 but in 2011 it traded more typical of a commodity market -- where there is often a momentum-oriented blow-off move. Still, if you were watching volatility dynamically, you would take note of it becoming riskier during the July-August advance.
The NASDAQ-100 actually dropped slightly less from high to low in 2011 vs 2010. Large-cap tech -- particulary AAPL have been relatively calm in 2011 -- which was also the case in 2010. Can it go 3 years with just a mid-teens drawdown? We don't know but there are certainly other more attractive segments as we close 2011.
It may sound odd but the losses in both 1) small cap US stocks (IWM) and 2) US Energy stocks (XLE) were about the same from high to low as the European ETF (VGK), which dropped -30%. However, both of the US ETFs have seen strong rebounds in Q4 and are a few percentage points from flat on the year.
Silver (SLV) is pretty consistently the most volatile (unlevered) ETF around and it didn't disappoint with a -41% high to low move in 2011 (and the year isn't quite over).
Treasury bonds ground out fantatstic years. We've blogged many times about how intermediate and low-duration bonds are the ultimate safe-haven. You can't count on consistent correlations in times of crisis -- but you can count on low-duration bonds, the fixed-maturity dates of the underlying securities ensure it. This is not true of long-term bonds -- which look susceptible to significant drawdowns in 2012. As much hype as the US downgrade received, it proved yet another meaningless move by the ratings agencies in the United States, which for some antiquated reasons seem to remain relevant to some.
Note that many ETF providers launched 'minimum volatility' ETFs in 2011. Since starting ETFreplay.com in early 2010 we have always used volatility as 1 of 3 key inputs in our multi-factor screener model -- so we are not surprised to see this development from the ETF providers. Volatility has and always will be important --- but it's certainly not the only thing that matters. Myopically focusing on volatility is taking this all too far as building ETFs off a singular concept like this is very limiting.
We view risk-adjusted (volatility-adjusted) relative strength as the cornerstone philosophy of ETFeplay.com and this led to a fixed-income bias throughout most of 2011. However, a tactical investment process continually looks to adapt to the environment --- and we would look for continue rotations in 2012 --- and every other year for that matter. There is plenty of room to add value in any year and it's up to you to figure out which group that is and how to manage it. In 2011, fixed-income ETF showed excellent total returns. You can't always be right of course --- but you can pursue a process on thoughtful consideration of which markets to be involved with --- and then layering some trend-following techniques on top of that --- all the while continually striving to protect yourself for the times you are wrong. If you simply stay consistently loaded in a group of highly volatile securities -- it is just a matter of time before you have a large drawdown.
As can be seen in our tracked Portfolio Allocations, we view equities to be attractive as we end 2011 -- particularly small and midcap US stocks. We see signs of P/E multiple expansion with rates low and liquidity being added to the problem areas of the global economy. However, even assuming we enter an intermediate uptrend (which may or may not occur), this does not mean that more rotations within the markets won't occur. It is never easy in the moment and we will carefully continue to watch and adapt to new potential themes/trends --- while always watching our backs to avoid too much portfolio volatility (and its associated drawdown).
Nov 10, 2011
in Tracking Error
We realize we've written a number of blogs now about 'nuances' in financial analysis. This is the nature of it; you must learn some of the details involved in assumptions. It is a part of what being a financial analyst is about.
The nuance we will discuss here concerns 'tracking error.' Tracking error just means how closely the ETF price reflects the underlying portfolio value.
The way an ETF provider measures ETF tracking error and posts on their website is to calculate the midpoint of the closing bid-ask spread vs the underlying per share value of the benchmark it is tracking. The nuance here is that this is not how regular closing price is determined in your brokerage or quote service.
Closing price defaults to the last trading price of the day. So we have a mismatch. On the one hand, if you went to trade a given ETF, you obviously would get it near the bid or ask. But if you are looking at the official exchange closing price on any given day, it will be the last price -- not the closing bid-ask midpoint.
This actually has important implications in backtesting as you could have large tracking error on market price -- even if there is low tracking error as calculated by the ETF providers.
Happily, there is an easy way to adjust for this; only use data where the ETF is liquid (and WAS liquid for the backtest period under analysis). If the ETF is liquid, it will actually be trading at the end of day and the closing price and the midpoint of the closing bid-ask will be very close and so true tracking error will be small.
We will point out that in this case, it is not that the ETF providers are doing something wrong --- they are showing a good reflection of an actual trade if done at the close. It is clearly up to the financial analyst to think about this and do their own diligence. You are the one responsible for your decisions in the end -- nobody else.
Let's say an ETF only trades a few times a day -- and let's say that on a particular day the last price was 10am. Then let's say the underlying index moved materially up or down into the close -- the closing price would reflect the 10am price -- despite clearly not being a true price you could trade -- and note that this difference would NOT be considered 'tracking error' because that is determined by the midpt of the closing bid-ask. But there clearly will be substantial tracking error using closing price data when the security is illiquid.
Again, there is a simple solution to this --- only use data where there there is substantial liquidity. We have hundreds of choices of liquid ETFs that have been liquid for many years now -- you don't have to bother with the 8th US Consumer Discretionary ETF that is slightly different than the first 7 but trades no volume. The data won't be any good. If its a valid investment -- 9 times out of 10 it will get to liquidity relatively quickly. If you want to use less liquid ETFs, that is fine so long as you understand the difference. Take pride in understanding these nuances, for it's part of being a good analyst.
Related to this topic, take note that we've listened to user requests and added a page to show New Additions to ETFreplay. We will continue to add any ETF that trades at least some level of volume. For what its worth, ETFreplay already covers >98% of overall ETF/ETN assets and >98% of the volume traded. The bottom 400 ETFs (some of which we do include if they are interesting new products) make up about 1% of overall ETF/ETN industry assets. There are plenty of choices already. Other than the handful of innovative new ETFs that come out every 6-12 months, focus your efforts on the existing liquid ones.
Sep 19, 2011
We have added a new module to ETFreplay.com that expands the functionality in a logical way. It is located on the My Account tab:
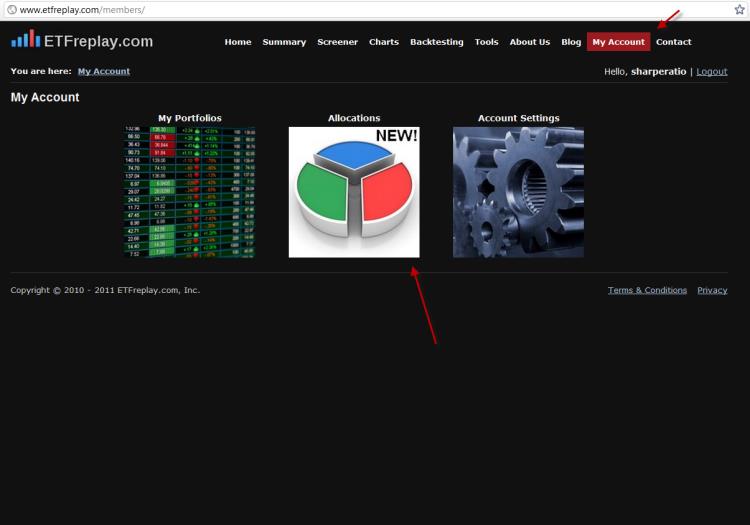
ETFreplay.com has advanced methods for screening and backtesting various relative strength and moving average strategies. The ETFreplay.com community runs thousands of backtests and it makes sense to see how members may be able to help each other with shared research ideas.
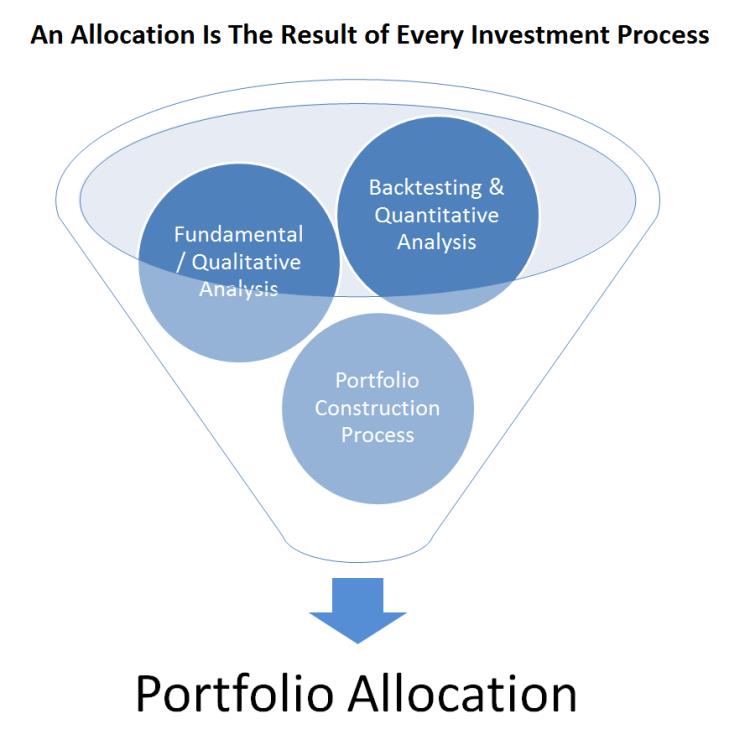
If you think about portfolio management, it doesn't matter what your process is --- in the end, when each day closes --- you have a portfolio filled with securities. Even if your portfolio is mostly cash, that is still an allocation. So our new Allocations module allows you to go to the final step in a process -- that is, take everything you know --- from fundamental to quantitative etc... and create an allocation. Once set-up, we will automate the tracking of the total return -- as well as calculate some of the most important items --- such as your portfolio volatility and portfolio drawdowns and sharpe ratio etc...
Importantly, you can do this privately if you would like --- or you can place the allocation you create on the public Allocations Board. You create your own customized fund symbol (ie, ETFRS) to identify the allocation. You can comment on each others allocations or choose to have comments turned off. You can keep watch lists of various strategies (from those which have chosen to be public). You can delete or create new allocations. We have tried to design it in a way that simply helps you to make better portfolio decisions. And as we've done with all of our applications, we will make the module significantly better over time.
ETFreplay.com has provided research applications that aid in the investent process --- but we simply can't model every possible variation of your requests into a few clicks. After you have researched and tested some ideas and have weighed all the variables and then have decided what to do, what we can do is capture the final allocation that you enter.
Note that we have installed some rules that may seem a bit rigid at first --- but these rules are necessary as we do not want to have this become a short-term trading competition. This is about portfolio management, not the latest earnings speculation or the macro news-of-the-day. The graphic below is one way to visualize the process as we see it.
Note that you can set an allocation to begin and it will use that days closing values. You can update on any day and it will then save the result of the historical fund return and subsequently combine that with the return of the new allocation. We will capture the total return of all securities (adjusting for dividends & cap gains distributions) so that your income securities are properly tracked. We know that relative to a real account, sometimes you will get a price that is different than the closing price -- but this is an allocation app and its purpose is to show various types of portfolio strategies --- not to perfectly mimic intraday trades.
Over the long-run, allocation moves are the overwhelmingly dominant factor in portfolio performance. Sometimes you may get into an ETF at a price $0.25 better than the closing price --- but this will be partially offset by the times your entry is worse. In the long-run, this is a lot less important than other factors.
We have been in beta testing on this the past few months and have worked out many of the details. We plan to add various features to this module over time. We are calling this a BETA product for now as we may have some plumbing adjustments necessary depending on how many people find use in this module and will surely have to allow for the scaling of data should many people like this feature. So please give it a try and tell us how you like it -- it is included in your existing subscription so there is no additional cost. We are excited about the potential this new application has should the ETFreplay.com community begin to share ideas and learn from each other not just through talk --- but through portfolio allocation actions.
Jul 21, 2011
in Total Return
Total return is a concept that is surprisingly misunderstood. We get emails asking why does our moving average not match Yahoo or Tradestation?
Most Internet data sources and brokerage software platforms don't track total return -- yet total return is how all index returns are stated. In 2010, the SPDR S&P 500 index fund (SPY) was not +12.8%, it was up 15.1%. Vanguards investment grade bond fund (VCIT) was not +5.1% in 2010, it was +10.0% (and had some nice tactical swings throughout the year). The difference was distributions (which come in 2 forms: dividends and capital gains distributions).
One common thing we see is for various people to compare their performance to the price-only +12.8% and then footnote it saying 'dividends excluded'? To us, this is just as bad as mutual funds that claim the expense ratio is 1.2% and then footnote it saying you will be charged a 3% redemption fee if you sell the fund in first 5 years. There are no hidden fees with ETFs -- no sales loads, no purchase or redemption fees, no 12-b-1 fees. The 'A-class' 'B-class' 'C-Class' 'H-Class' 'I-class' mutual fund system is non-sensical in the ETF world --- there is only a single class of an ETF.
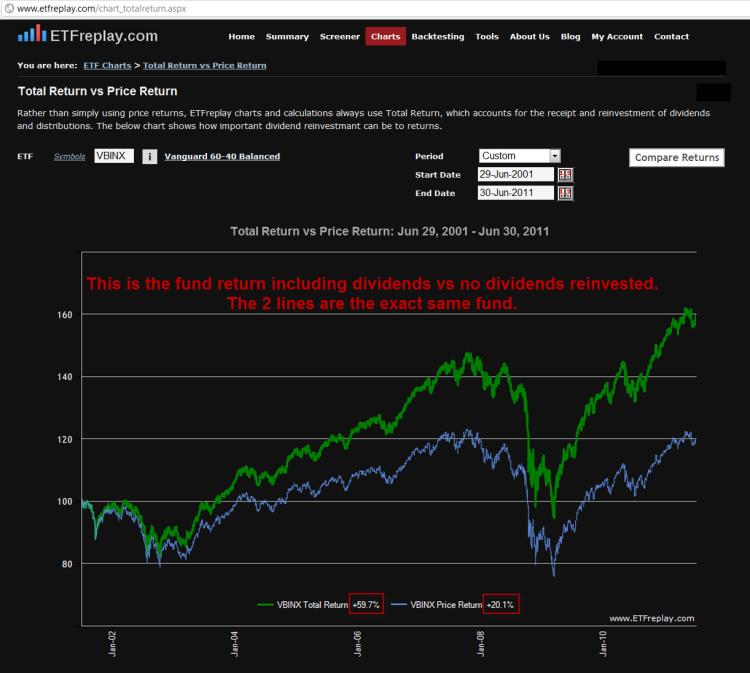
Here is another one: the Vanguard 60-40 stock-bond balanced fund returned +20.1% for the 10 years ended June 30th, 2011 [1]
[1] excludes dividends
Well, a large part of owning a bond in the first place is the coupon. As it turns out, that index fund (VBINX) was +59.7% INCLUDING dividends. So it is entirely disingenuous to compare to a number that is one-third of the actual index return.
While this is all obvious to some -- it is clearly still not understood by many.
We created a free Comparison Tool to make it easy to view this concept as we feel the only REAL way to truly understand something fully is to interact with it through an application -- rather than just read about in a paper or on a blog.
Try a few out. Be aware that even if its not a large dividend payer, any capital gains distribution will also affect the return.
Bond ETFs:
Others: