Jul 08, 2010
in Relative Strength
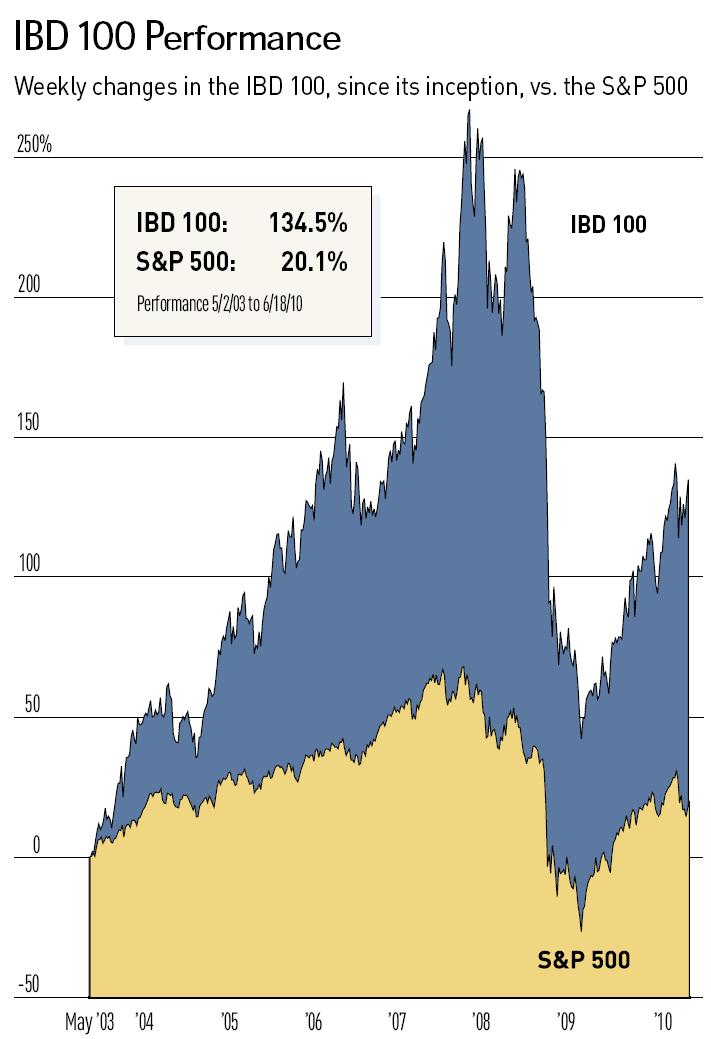
The Investors Business Daily (IBD) 100 is at its core a Relative Strength backtest of the IBD stock universe. Note that IBD's method is to also use its larger market BUY and SELL signals and these do not show up in the chart below.
If you use fixed-income ETFs in your ETFreplay screening / backtesting lists -- you effectively automate the 'Buy-Sell' signals by naturally rotating into the higher relative strength bond ETFs as stocks breakdown and bonds rally. We suggest using intermediate or short-term bond ETFs in your lists. Long-dated treasury ETFs can suffer from very high volatility -- and a key concept is to avoid highly volatile securities UNLESS they offer high expected returns. This is unlikely the case for most bond ETFs -- bond ETFs best attribute is their stability in times of turbulence.
Note also that while the IBD 100 is compared to the S&P 500 below, it does often own foreign stocks that trade on U.S. exchanges. While we cannot calculate the volatility of the IBD-100 since we don't have the data series, we suspect its volatility is far greater than the S&P 500. Remember that when volatility is HIGHER, you would EXPECT larger relative drawdowns.
This image captures the cumulative return of the IBD 100 index up through June 18, 2010 (note the massive drawdown in 2008).
Jun 13, 2010
in Screener, Video
ETF rotation is the focus of this video - showing how the Portfolio Screener Ranks tool can be used as an easy way to visualize leadership in custom ETF lists created by the user.
This video shows this new functionality by using recent news involving Bill Gross of Pimco and how relative strength LEADS the news.
May 27, 2010
in Relative Strength, Video
This video discusses some ideas related to our powerful Portfolio Relative Strength Backtest. The key to understanding how it works is to understand its relationship with the ETF screener
Comments and feedback appreciated.
Go to the Portfolio Relative Strength Backtest
Not a subscriber? Subscribe
May 16, 2010
in Correlation
First, a chart of GLD vs the FXE Euro Currency ETF is a simple yet powerful way to show the primary issue in the world right now:
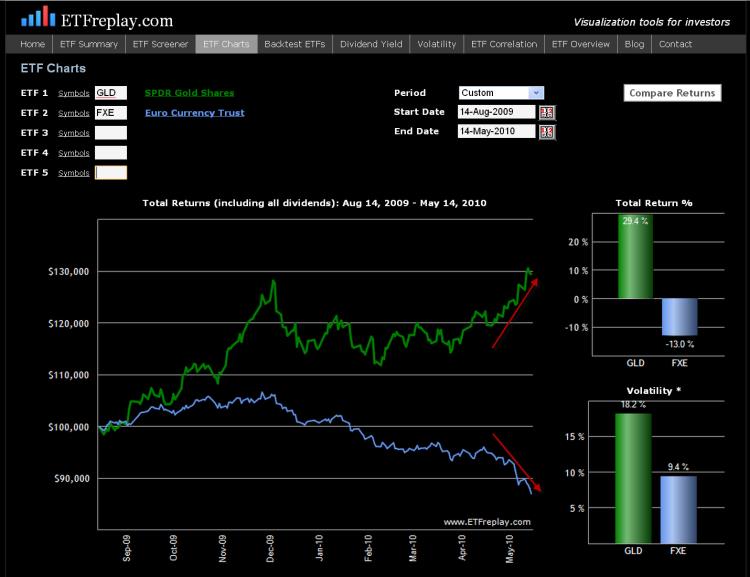
This EC (Euro currency) crisis has brought on a volatility storm (sharply rising volatility / VIX). It is common to hear analysts and portfolio managers say; what does a Greek default have to do with my US domestic small cap stock?? Well, a lot actually if the Greek problems lead to a crisis – as a crisis will cause overall market volatility to rise.
Correlations RISE in times of crisis. This is not just a random statement, it can be viewed mathematically using the Capital Asset Pricing Model (CAPM) framework.
In CAPM, the correlation between two assets can be expressed as a function of their Betas and the variance of the market. If we assume that both assets have a beta of 1.0 and identical residual risk, then it becomes mathematically true that correlations rise as variance rises. Thus, some type of crisis causes overall variance to rise (in this case it’s the escalating debt problems in Europe) and then this rising variance will cause correlations to rise.
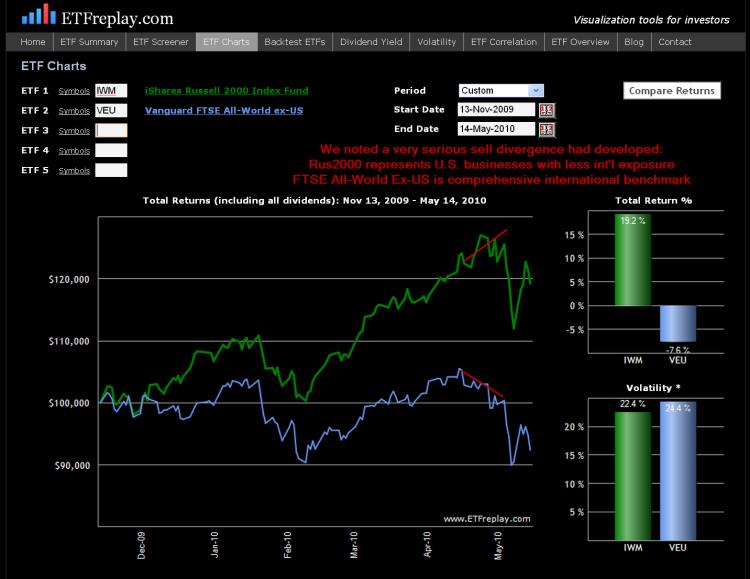
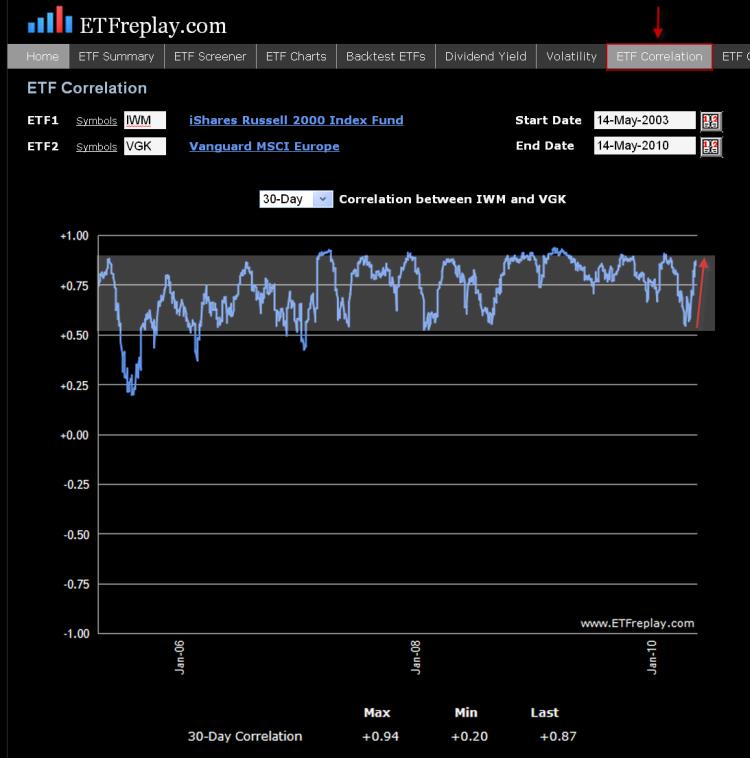
Note the serious divergence of small cap US stocks and the MSCI ETF Europe (correlation at first drops on the lower chart) -- and then the subsequent increase in ETF correlation when VIX / volatility increased sharply.
For a more complete technical explanation of this topic see "Active Portfolio Management" (Grinold & Kahn, 2000). This book is extremely technical and really only for professional investors with mathematical orientation.
May 11, 2010
in Stop Loss
In portfolio management, the term strategic is code for long-term. The term tactical is used as a way to describe a strategy that is shorter-term, such as a portfolio adjustment based on seasonality.
So for example, you may want to own the India Fund (INP) in a strategic long-term sense --- though you may be underweight on a tactical/short-term basis etc… Or you may not care about the Gold ETF (GLD) long-term but you see a tactical opportunity in it now --- something we have highlighted recently.
We know that you can greatly improve your Sharpe Ratio by employing some relative strength strategies to your ETF investing. One of ETFreplay.com’s primary strengths is allowing users to easily test various overweight/underweight methods. Our relative strength application ‘updates’ on a pre-defined date -- we do not use stop loss orders. The ‘stop’ is in effect the next update period. We view this as a far superior method as it removes the emotional nature of the markets and keeps you from acting on whipsaws, like we saw last Thursday. But the primary benefit of this framework is that it keeps you focused on the bigger picture -- and it is global asset allocation that ultimately drives 90%+ of your portfolio returns. Is your portfolio positioned correctly as of the end of each quarter? Is it positioned correctly at the end of each month? You can of course update your portfolio during any day – but hopefully, you are doing this in accordance with a larger strategic plan.
If you plan ahead and watch your overall volatility, you can sleep at night knowing that you have the Sharpe Ratio on your side. Over the long-term, the relative strength models will find markets that go up ---- and good portfolio management will limit your drawdowns. If instead you recklessly buy a list of securities and have no idea what your portfolio volatility even is --- then you are going to be placed in some very difficult situations. The key is to plan ahead of time. Hopefully, our models and backtests can aid you in this thought process and help you find some good reward-risk situations to overweight.
On Monday, the market gapped up a very large percentage on the nearly 1 trillion Euro bailout. Importantly, this followed a very significant correction in European stocks. This is the kind of thing that is a more technical aspect of tactical portfolio moves. Indeed, vicious short squeezes should be viewed as the norm after sharp market corrections, like that experienced in Europe. This is the very definition of volatility.
Precious metals --- Gold (GLD) and the precious metals ETF (DBP) are the thematic leaders of the market now. Be on guard regarding your overall portfolio as volatility has surged – but keep your tactical trades in line with your strategic ideas and you will consistently be updating your portfolio with the best reward-risk situations. Combined with intentionally keeping your volatility low, your Sharpe Ratio will rise – and this should be your ultimate focus.