Category: Dashboards
May 26, 2025
in Dashboards
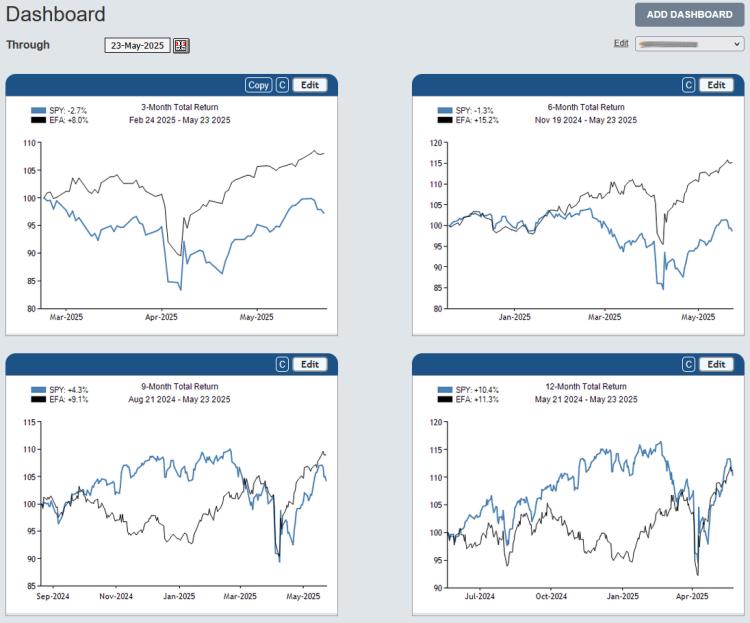
We have added a new window option to the dashboard; Total Return Chart.
The new chart displays the total return value of 1 or 2 securities over the specified lookback period.
The dashboard example below has 4 charts that show the performance of EFA and SPY over 3, 6, 9 and 12-months.
click image to view full size version
See: Introducing Dashboards: A Way To Help Organize Workflow In Research & ETF Portfolio Backtesting
Jun 20, 2024
in Moving Average, Dashboards, Timeline
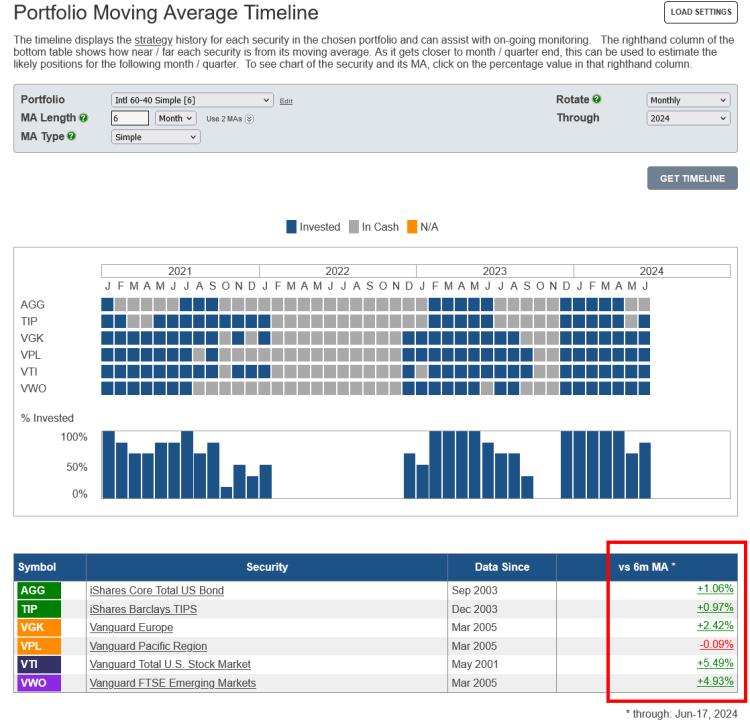
Q. "How can I check for moving average crossovers on the ETFs in my portfolio each month?”
A. To monitor a moving average model you can use either the Portfolio MA Timeline or set up a Dashboard.
click image to view full size version
While the Timeline’s main graphic displays the invested history of each security in the portfolio, the far right column of the data table shows how near / far each ETF currently is from the chosen MA. As it gets closer to the end of the month, this can be used to estimate the likely positions for the following month. Clicking on the percentage value in that column will produce a pop-up window that displays a chart of the ETF and its moving average.
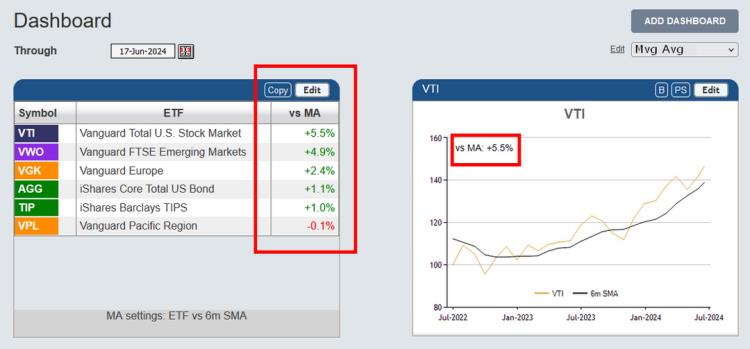
Alternatively, rather than using the Timeline, you can create a Dashboard and then add :
- MA List - displays the vs MA % for each ETF in your portfolio.
- MA Chart - vs MA % will be displayed on the chart
click image to view full size version
See: Introducing Dashboards: A Way To Help Organize Workflow In Research & ETF Portfolio Backtesting
Notes:
-
Moving Averages on ETFreplay are calculated using Total Return. i.e. the calculation does not just use closing prices but also accounts for the receipt and reinvestment of any dividends and distributions. The MA is then compared to the Total Return value of the ETF, so that it's like-vs-like; everything is Total Return, not just price. See the FAQ How are moving averages calculated?
-
Timelines are also available for Portfolio Ratio MA and Channel models.
Sep 02, 2022
in Dashboards
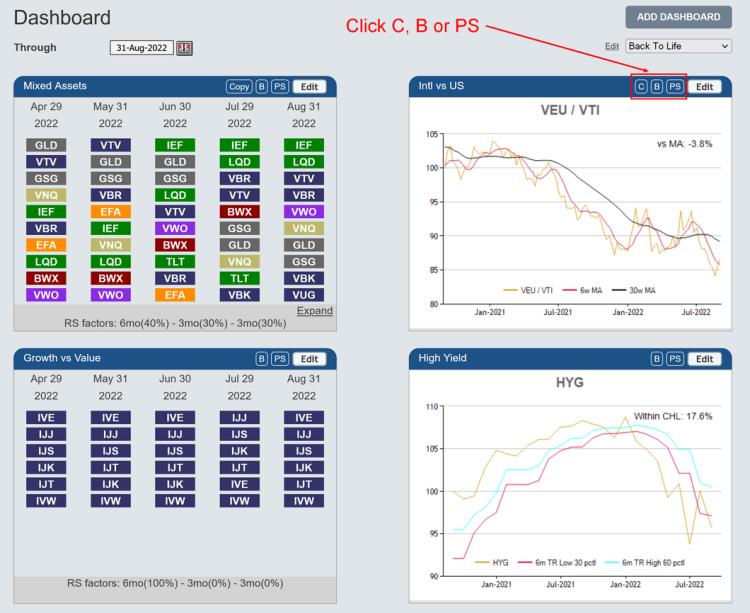
We have added the following new options to dashboard window headers to make it easier and quicker to access related tools:
- C - click to open a new browser tab containing the Charts page that’s auto populated with both securities from the dashboard window
C appears above Ratio MA chart and TRD chart
- B - click to open a new browser tab with the relevant Backtest auto-populated with the securities / portfolio and parameters from the dashboard window
B appears above Ratio MA chart, MA chart, CHL chart, TRD chart and Ranks
- PS - click to open a new browser tab containing the Parameter Performance Summary that's auto-populated with the securities / portfolio and parameters from the dashboard window.
(note: Parameter Performance Summaries are available to annual subscribers, both regular and pro)
PS appears above Ratio MA chart, MA chart, CHL chart, TRD chart and Ranks.
click image to view full size version
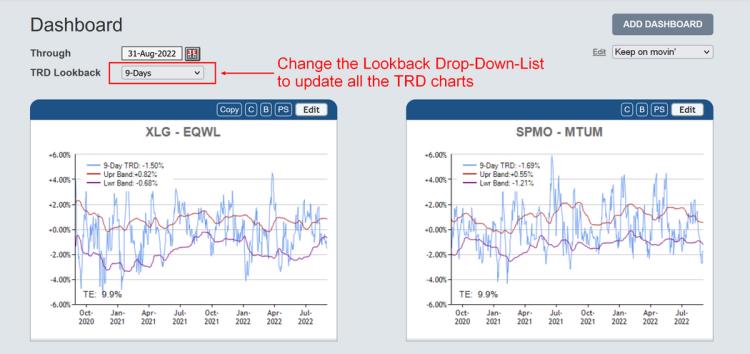
In addition, if all windows on a dashboard are TRD charts, a TRD Lookback drop-down-list now appears at the top of the page, beneath the ‘through’ date selector. This drop-down-list controls all the TRD charts on the dashboard, making it very easy to switch between lookback lengths.
By default it is set to 'Saved Value'; each of the TRD charts displays its own saved lookback length. If the drop-down-list is changed to 9-day, for example, then all the TRD charts on the dashboard will be recalculated and display a 9-day TRD. etc.
click image to view full size version
Jul 05, 2022
in Backtest, Dashboards, Tracking Error
We have added some new functionality to the Core-Satellite backtest, Tracking Error tool and Dashboard.
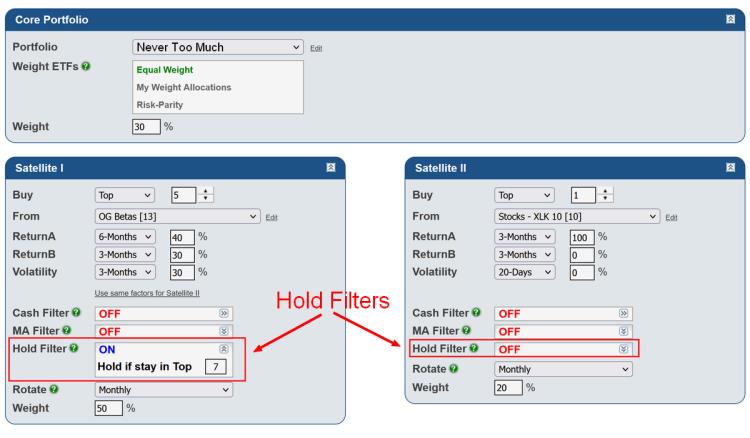
Core-Satellite
The Core-Satellite backtest has an updated look and the Hold Filter, which we recently added to the Portfolio RS and RS - Combine Portfolios, can now be applied to either (or both) of the satellites.
click image to view full size version
The appearance of the other parallel relative strength backtests, the sequential RS and various regime backtests has been similarly updated.
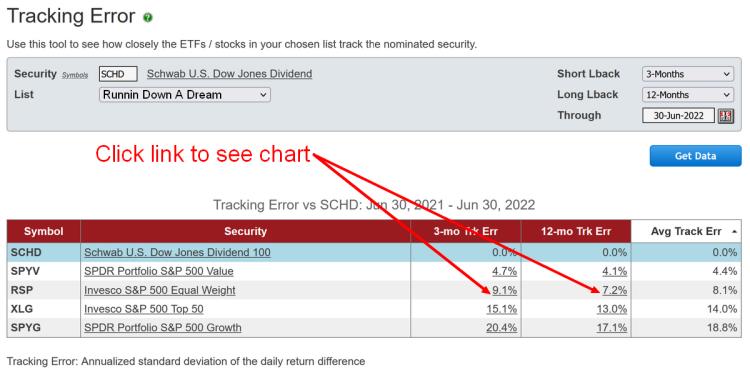
Tracking Error tool
The tracking error values now link through to the ETF charts page, which will automatically load the two securities over the specified duration and display their performance.
click image to view full size version
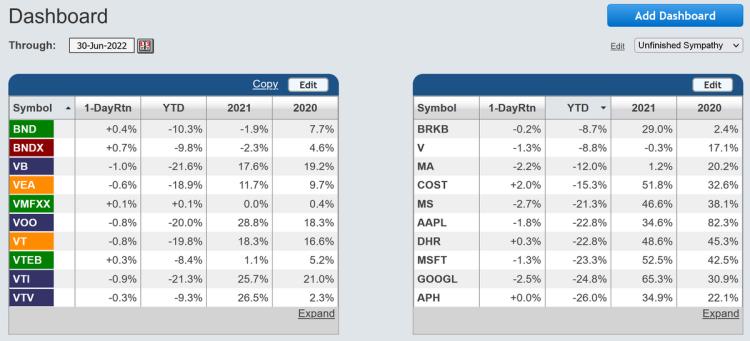
Dashboard
We recently added a new Summary window option that displays the 1-Day, Year-To-Date, 2021 and 2020 Total Return of each security in your chosen list.
click image to view full size version
Mar 05, 2019
in Video, Dashboards
We have added Dashboards as a new feature to the website so that subscribers can easily view multiple models and/or markets in one place.
Dashboards can be used in numerous different ways, including:
- to view market activity from various angles with a mixture of several different models
- to look at one model applied to several different ETFs / markets
- to monitor different variations of a single model
etc etc.
Most importantly, you have the choice of how to set up your own personal dashboard(s).
To create a dashboard:
- From 'My Account' in the top menu, choose 'My Dashboards'
- Click 'Add Dashboard' button in the top right corner, enter a name and click save
- A dashboard with 6 empty windows will now appear
- Click the 'Add Item' button in top right corner of one of the empty windows
- Choose between:
- 'Screener'
- 'Ranks'
- 'Ratio Chart'
- 'MA Chart'
- 'MA List'
- 'Channel Chart'
- Enter the rest of the required details, click 'Save' and the desired chart or table will appear in the window.
- Repeat steps 4, 5 and 6 for the other empty windows, up to a total of 6 per dashboard
- Items can be edited / removed by clicking 'Edit Item' in the top right corner of the required window
- The 'through' date can be changed via the calendar control in the top left corner
The video below demonstrates one way to use ETFreplay Dashboards:
to expand video on screen, click the 'expanding arrows' icon in the bottom right corner of the video screen