Sep 02, 2025
in Backtest
We have enhanced the ETF Portfolio Backtest with a couple of upgrades.
First, there is now the option to mark rebalance events on the main chart. If the backtest is primarily rebalancing into risk-on assets (typically buying equities) because they are under weight compared to their starting / target weight, the 'R' icon is blue. If the backrest is predominantly rebalancing away from risk-on assets and towards risk-off / lower volatility assets, the 'R' icon is red.1
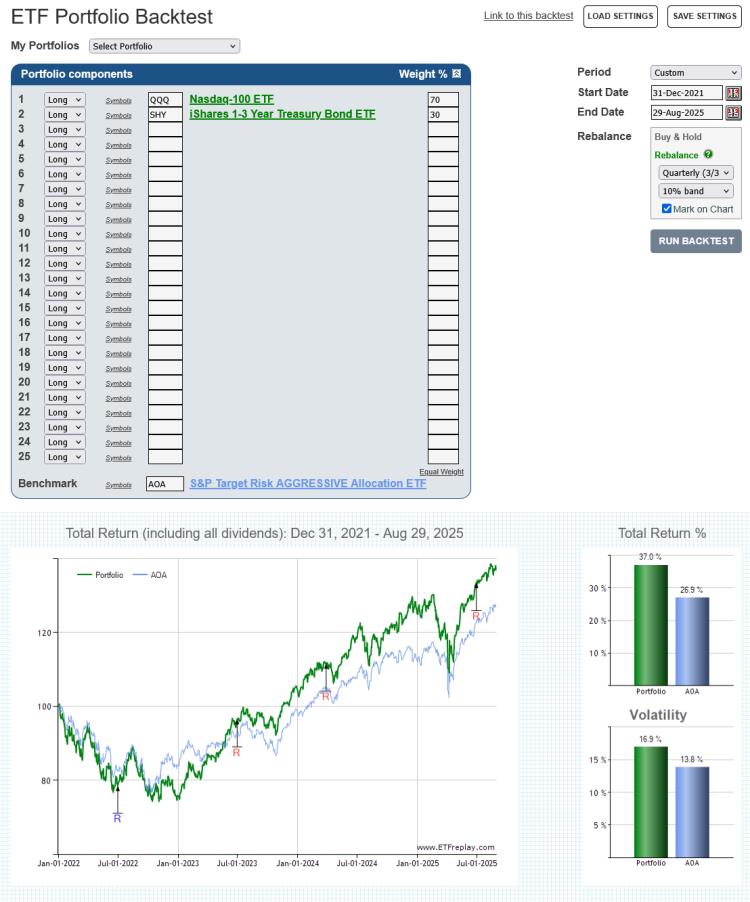
click image to view full size version
Second, we have added the functionality to save and load all the backtest settings; portfolio, benchmark, rebalance option, start / end dates etc.2
Go to the ETF Portfolio Backtest.
Note:
- To prevent the chart from becoming a cluttered mess, no ‘R’ icons will be displayed on the chart if there are more than 25 rebalance events.
- Regular subscribers can save up to 5 different sets of settings. Pro subscribers can save up to 20.
Jul 08, 2025
Pro Subscribers now have the option to edit, or add, imported data directly, rather than importing an Excel spreadsheet each time.
To use this new functionality, click the ‘Edit Data’ button above the Imported Data Series table.

The edit page will then automatically load with the last date from your imported data series. Change the date to go back and edit older data, or forward to add new data.

When wanting to insert, or overwrite, large amounts of data, Importing an Excel spreadsheet remains preferable.
Pro Subscribers can create up to 25 Imported Data series and they can then be used with any backtest. Regular subscribers can upgrade to a Pro Subscription at My Account > Subscription Settings > Upgrade to Pro.
May 26, 2025
in Dashboards
We have added a new window option to the dashboard; Total Return Chart.
The new chart displays the total return value of 1 or 2 securities over the specified lookback period.
The dashboard example below has 4 charts that show the performance of EFA and SPY over 3, 6, 9 and 12-months.
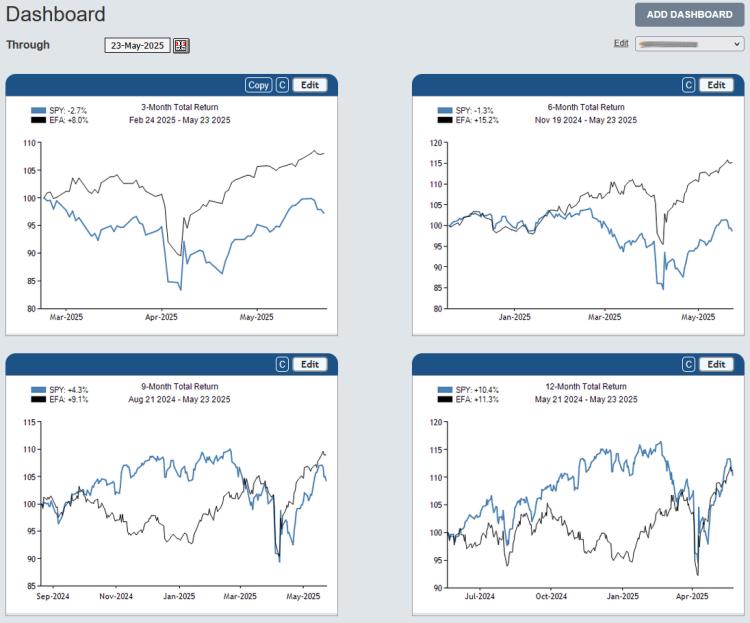
click image to view full size version
See: Introducing Dashboards: A Way To Help Organize Workflow In Research & ETF Portfolio Backtesting
Apr 08, 2025
in Channel, Parameter Summary
We have made two upgrades to the Channel Parameter Performance Summary.
Firstly, the Channel Parameter Summary now allows a range of Buy and Sell points to be tested. Whereas previously only a single Buy and Sell point could be specified, it is now possible to set min, max and step values for these two parameters.
Secondly, a Substitute function has been added, which allows a different / replacement security to be specified for the execution of the actual trades. For example, a channel can be based on the Total Return value of QQQ, but the resulting trades can be executed in QLD.
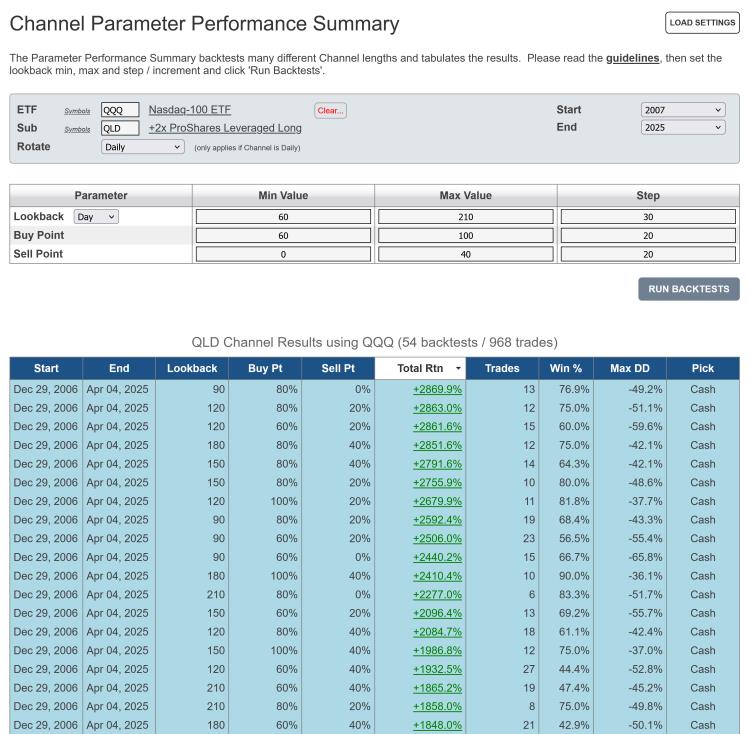
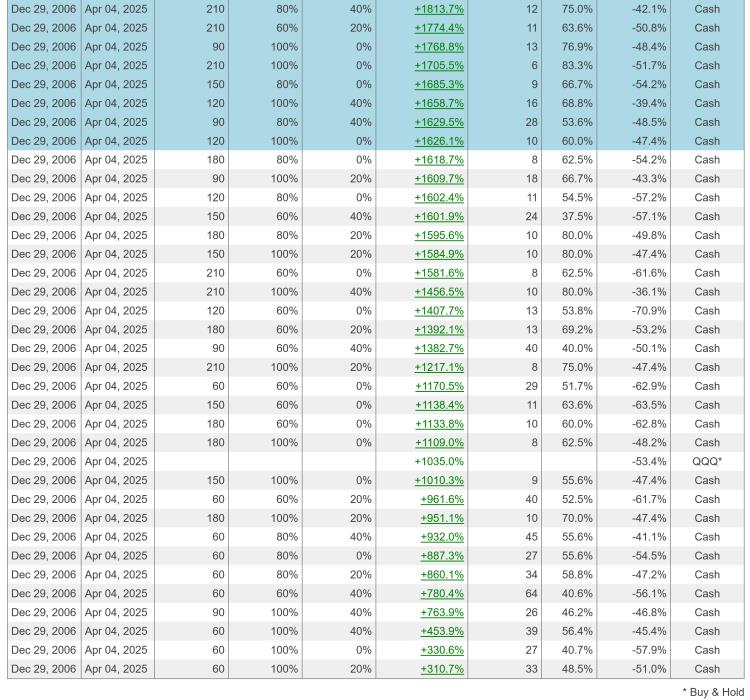
click images to view full size versions
Go to the Channel Parameter Performance Summary
Notes:
- Studying the guidelines is strongly recommended.
- Parameter Performance Summaries are available to both regular and pro annual subscribers
Mar 04, 2025
in Moving Average, Channel
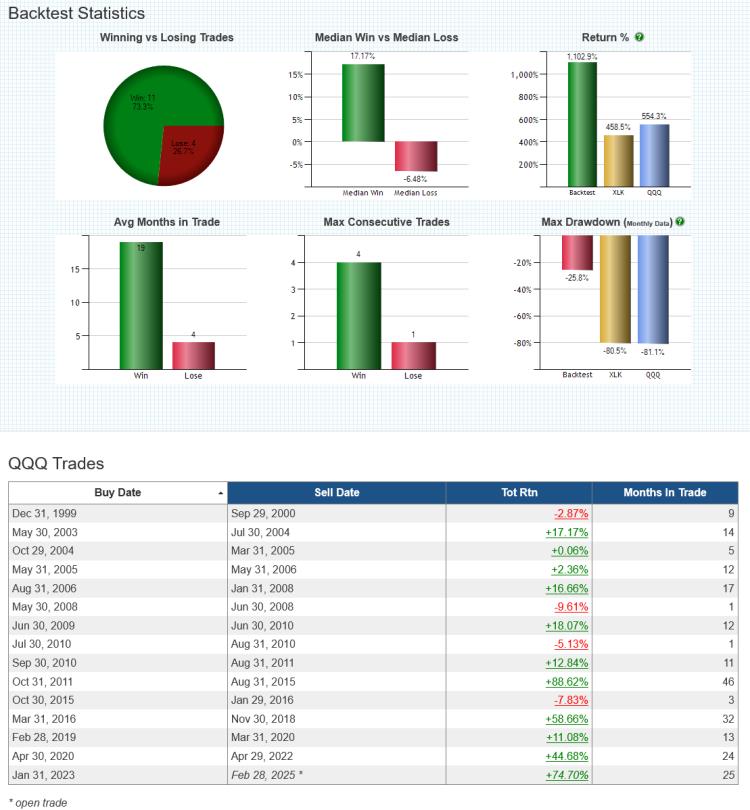
We have added a 'Substitute' function to the ETF Moving Average and Channel backtests.
Clicking 'Substitute' allows subscribers to specify a different / replacement security for the actual trades. For instance, in the example below the backtest invests in QQQ when XLK is above its 12-month Exponential Moving Average (EMA).
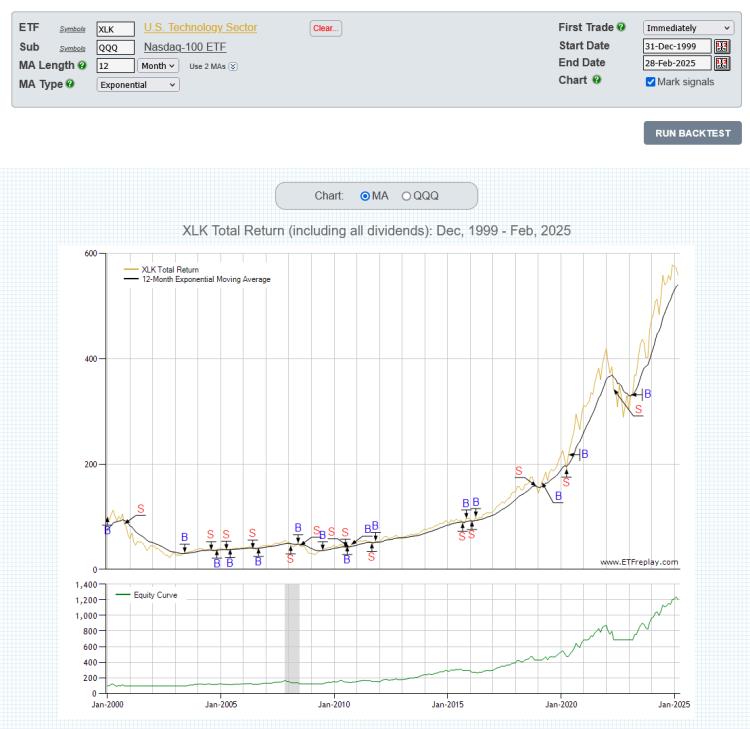
click chart images to view full size versions
The Substitute function is available to all subscribers on the following backtests:
Note:
To test investing in Portfolio A when x security is above its MA and Portfolio B when x security is below its MA, use the Regime Portfolios backtest.