Comparing 2 Ultra-Simple ETF Backtests Side By Side
Jan 15, 2019
in Backtest
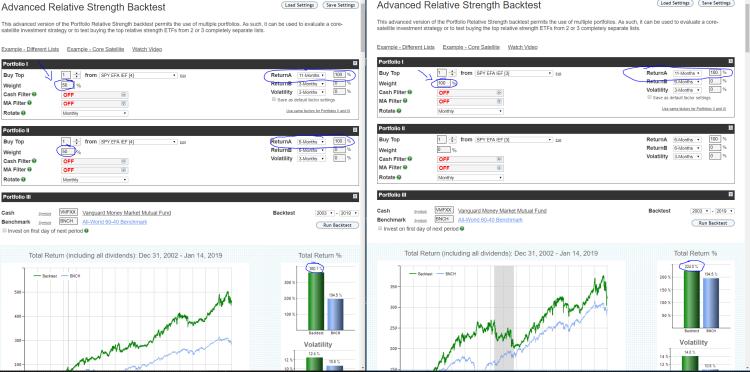
The example below is pretty self-explanatory but in a nutshell it compares 2 strategies set side by side in detached browser windows.
Strategy A on left uses 2 pieces: 1. 50% choose 1 of 3 ETFs using 11-month total return 2. other 50% using 6-month returns on the same portfolio of ETFs, also choose 1...
Strategy B on right using 1 strategy: using ONLY 11-month returns.
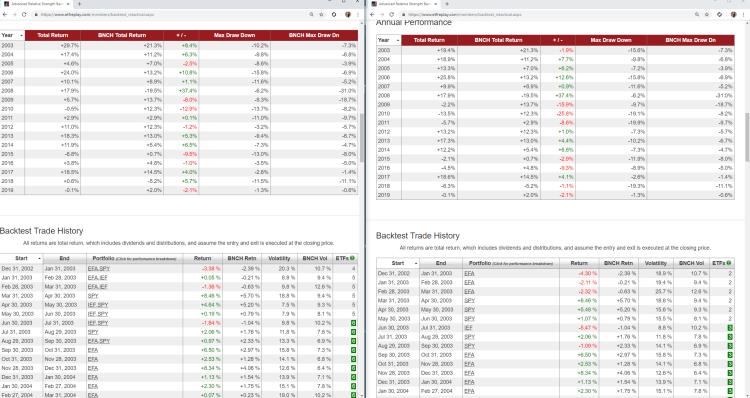
Rather than only highlight just the overall total return of each, of high importance is looking at the year by year (Calendar) returns vs a benchmark. The 100% 11-month strategy has seen years of large outperformance and underperformance. The blended strategy would have been much easier to stick by and actually achieve the end result - in addition it added return over the period. We know from many research papers that 3 - 12 month relative strength all have some level of validity long-term. No matter what the very long-term backtest looks like for these 2 strategies, we cannot know for sure which one is going to do better over the next 10 years. But we can glean information by studying different types of backtests and help make a judgment about what is happening now. Indeed, backtests primary function is to help guide you to understand what is happening in the most recent (current) period.
Follow ETFreplay on
