What was the S&P 500 Total Return for 2023?
Jan 01, 2024
in Total Return
The chart below displays the 2023 Total Return for a few different types of S&P 500 ETF (growth, value, market-cap weight, equal weight and low volatility):
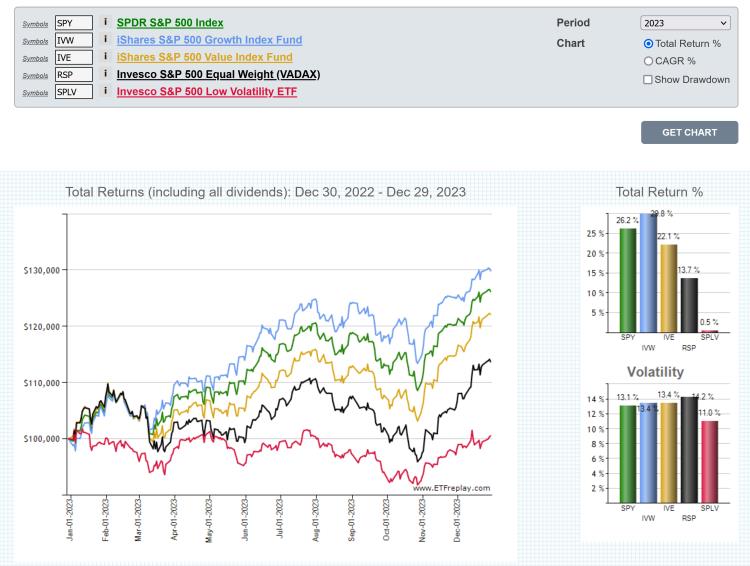
click image to view full size version or go to the chart page
To put the performance of the market-cap-weight S&P 500 into global perspective, the below chart and table shows 2023 Total Return of SPY alongside a selection of developed international and emerging market country funds.
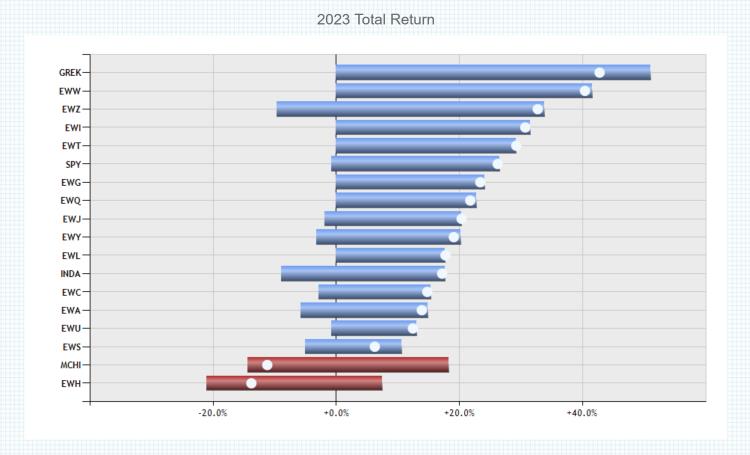
click image to view full size version
note:
Total Return accounts for price appreciation and the receipt and reinvestment of dividends (and any other distributions, such as capital gains distributions). See Total Return vs Price Return
Follow ETFreplay on
