Dec 09, 2021
in Relative Strength, Mean Reversion, Regime Change
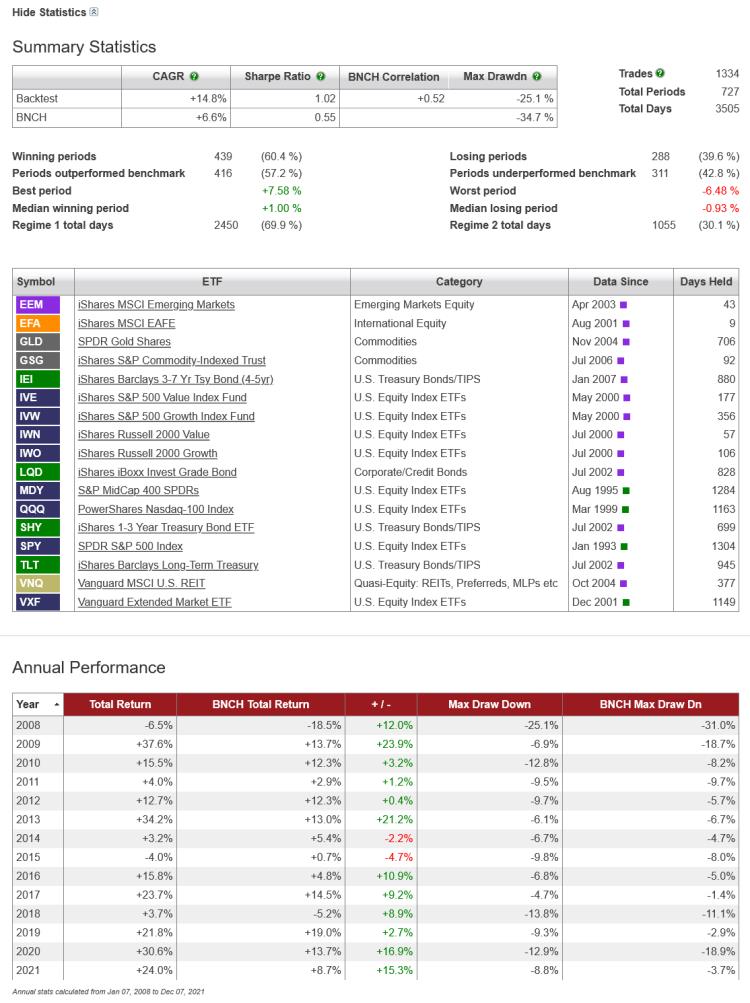
This example employs a simple credit spread style ratio to define the prevailing risk on / off regime and uses that to switch between different strategies.
When the High Yield / Treasury ratio is trending upwards (i.e. short MA above long MA) the backtest pursues a mean-reversion strategy, investing in the weakest short-term performers (buying wholesale) in a list of broad U.S. equity ETFs.
Conversely, when the HYG / IEI ratio trends down (short MA below long MA), the backtest switches to a Relative Strength strategy; buying the top five from a list of mixed asset class ETFs. Selecting the strongest five securities from the list provides some diversification while also giving the backtest the opportunity, in bear markets, to allocate 80% to fixed income and, in the most severe periods, to avoid equities entirely.
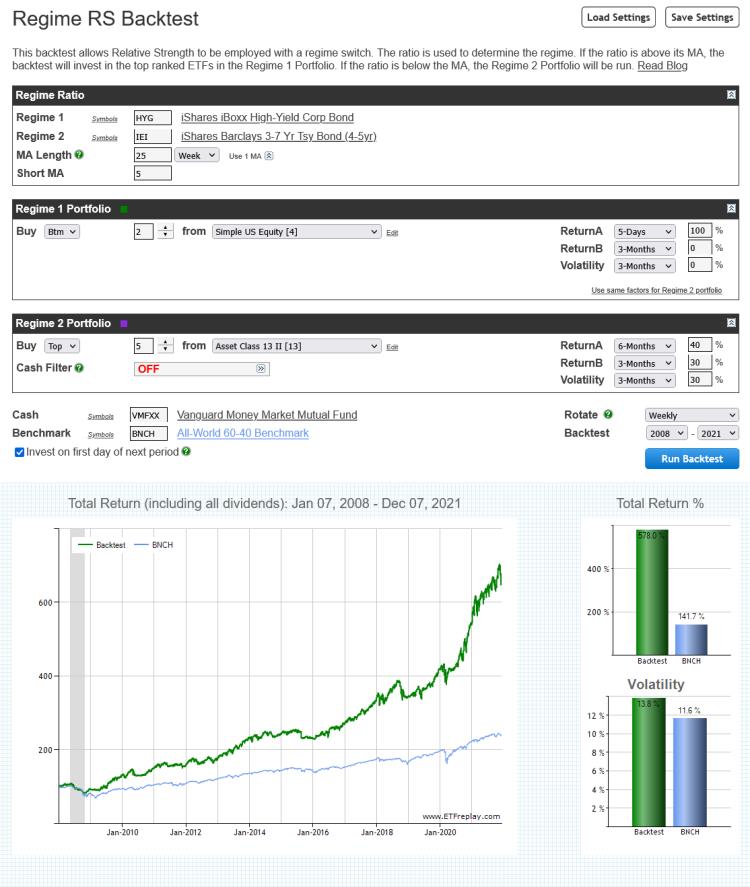
Specific parameters and ETFs are not the focus of this example, rather, it is intended to highlight the backtest functioanlity and to provide a starting point for subscribers to further research and develop.
Oct 17, 2021
in Backtest, Relative Strength, TRD Total Return Diff, Video, Ratio, Parameter Summary
Instructional video on how to use the Parameter Performance Summary functionality. #STUDY
to expand video on screen, click the '4 expanding arrows' icon in the bottom right corner of the video screen. Use the settings icon to change to 1080 quality if it seems at all blurry
Aug 31, 2021
in Backtest, Moving Average, Channel, Ratio, Parameter Summary
We have added three new Parameter Performance Summaries to the website:
As with the Relative Strength and TRD summaries that we introduced in July, each of the above can be accessed from their respective backtests.
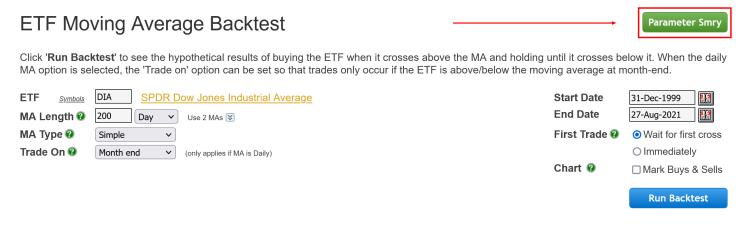
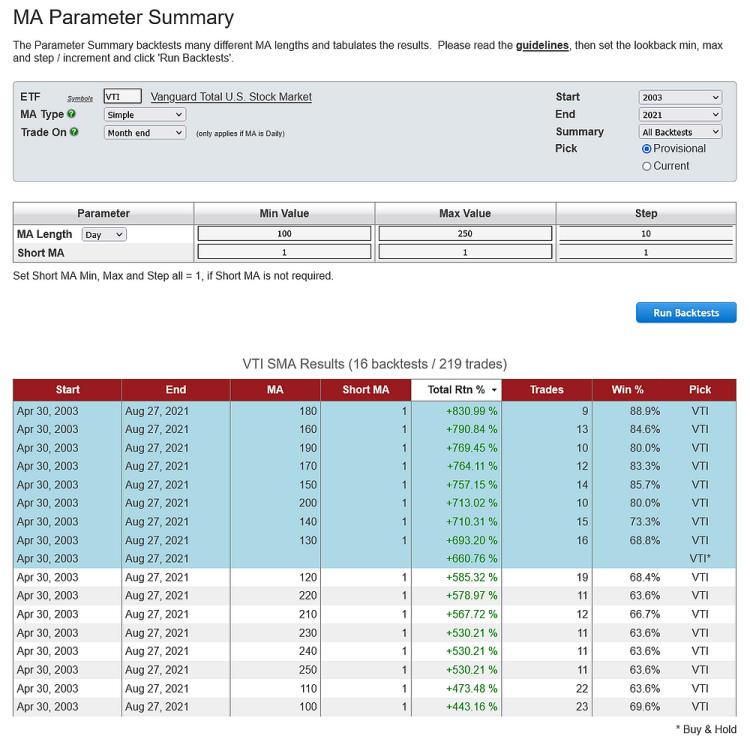
Set the min, max and step / increment for each parameter, then click 'Run Backtests' and the tabulated results will be displayed:
Parameter Performance Summaries are available to all (regular and pro) annual subscribers.
** studying the guidelines that we published within the original Parameter Summaries announcement is highly recommended **
Jul 21, 2021
in Backtest, Parameter Summary
We have just added new functionality to the site that makes it possible to backtest numerous different parameter combinations in one go. We have started with two Parameter Performance Summaries, one focused on relative strength and the other on mean reversion:
Parameter Performance Summaries are available to annual subscribers, both regular and pro, and can be accessed from their respective backtests.
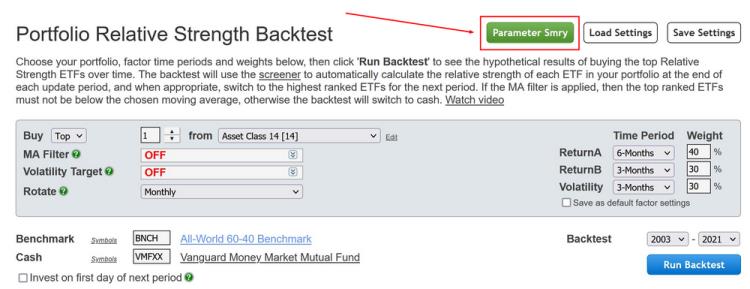
Set the weight, min, max and step / increment for each required parameter, then click 'Run Backtests' and the tabulated results will be displayed:
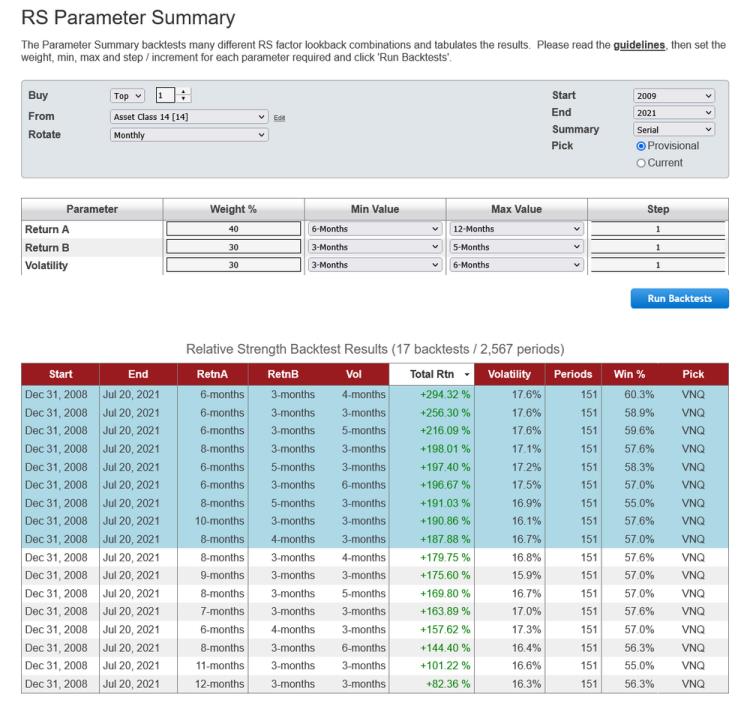
Backtesting is the only way to know if a strategy works, but it obviously does not guarantee good future performance. Following a solid testing procedure, however, puts the odds in your favor. To that end, we recommend keeping the following in mind when using the Parameter Performance Summaries:
- Backtest results shouldn't be used to justify a model; it needs to have a sound underlying rationale to begin with.
- Choose a range of parameter values that make sense for the strategy. i.e., very short lookbacks aren't suited to a strategy targeting longer-term trends and vice versa. Sticking to appropriate parameter values lessens the possibility of being misled by an isolated / lucky result.
- Larger step / increment values can be used initially to identify the approximate range of parameter values that have produced the best returns. More detailed testing, with smaller step values, can then be done on that range of parameter values..
i.e., begin with a wider spread between min and max and a larger step value. After identifying a narrower min / max spread, the step value can be reduced.
Alternatively, when employing 2 or more factors, choose 'Serial' rather than 'All Backtests'. Rather than backtesting every parameter permutation, Serial employs a multi-stage process that reduces the total number of backtests performed, thereby allowing longer periods of time and/or a wider range of parameter values to be tested.
- When examining the results:
- A robust model will be moderately sensitive to small differences in parameter value. i.e. performance will vary, but slightly different parameter values should not produce wildly different returns. Larger differences in parameter value, by contrast, should be expected to have a bigger impact on performance. (note: adjacent monthly parameters will exhibit larger performance differences than adjacent daily lookbacks.)
- If the top performing parameter's returns are far above the rest, then it indicates that its results likely benefited from good luck.
- The best parameter / lookback values are generally those that show consistency over time. i.e. parameter values that were hugely successful in favorable environments but performed poorly in other conditions, are less desirable than parameter values that produced solid returns across different market environments.
- The overall backtest should be of sufficient length to include a mix of environments; up, down and sideways markets. Examining shorter periods within that backtest is also worthwhile, as it’s unlikely that the best overall performers were strongest in each and every sub-period. Recognizing that even the best strategies have endured periods of under-performance can help set realistic expectations.
- The Parameter Summary provides an overview, but it’s important to go beyond the headline statistics once a set of parameter values has been identified. Run a backtest and examine the return and drawdown for each year vs your benchmark. Was it a wild ride? Could you have actually stuck with it (be realistic)? Does huge out-performance in only one or two years mask under-performance the rest of the time? If so, was that because the model does well only in a particular environment, (if so, can you live with that?) or, was it just lucky at certain times?
- The future is all that matters and it won't be exactly like the past, so there's little point in trying to precisely optimize historic performance.
You may need to refresh the site to force your browser to download all the necessary files from the server afresh in order for the pages to render correctly. To do this, hold down the Shift key on your keyboard and click on the circular arrow icon to the left of address field at the top of the browser window.
May 24, 2021
in Video, Sequential RS
Reviewing some recent actual trading from the lens of some of our backtesting applications. #STUDY
to expand video on screen, click the '4 expanding arrows' icon in the bottom right corner of the video screen. Use the settings icon to change to 1080 quality if it seems at all blurry