Mar 03, 2020
in Backtest, Mean Reversion, TRD Total Return Diff
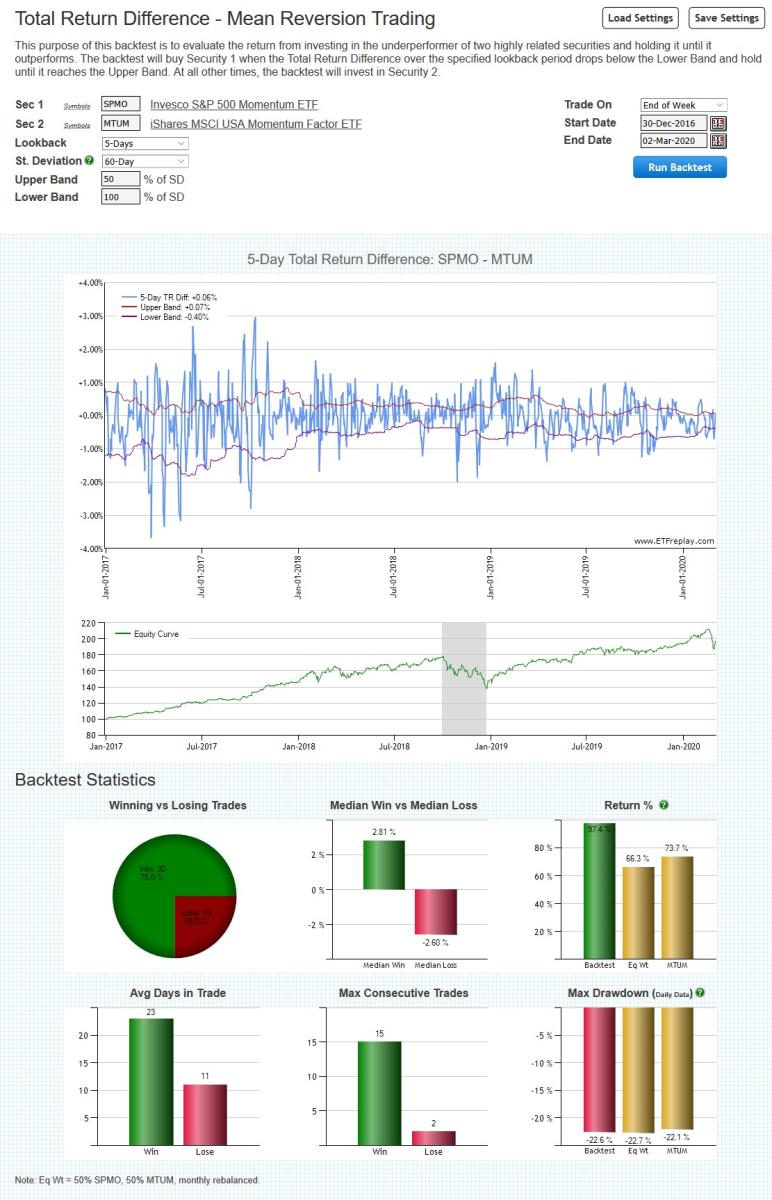
We have introduced a new backtest for subscribers that is focused on short term mean reversion. It is intended to be used with highly related securities, which are unlikely to drift apart for very long before coming back together. Consequently, when one of the securities underperforms by a non-insignificant margin, an opportunity occurs.
The backtest works by comparing the difference in the x-day Total Return between the securities / ETFs. When that x-day return difference is more than y standard deviations below the mean, the backtest will buy Security 1. It will then hold that security until it reaches z standard deviations above the mean, when it will be sold in favor of Security 2.
Suitable primarily for non-taxable accounts only, the idea is that these short-term trades among correlated assets can be used to materially enhance the returns through compounding without a material difference in the underlying beta exposure. More return not for less risk -- but for very similar risk. Said another way, taking a modicum of extra risk can be quite profitable.
Go to Total Return Difference (TRD) - Mean Reversion Backtest
Dec 16, 2019
in Relative Strength, Mean Reversion, Video
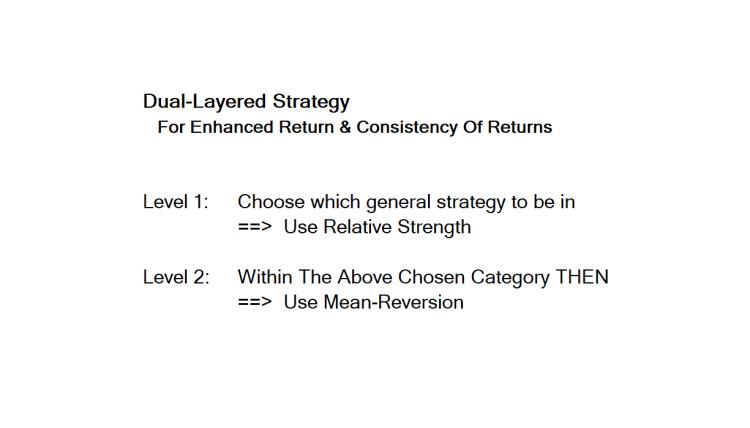
Layering 2 strategies on top of each other for better return -- and importantly this can improve the consistency on a year-to-year basis. The mean reversion strategies tend to add more return when things are volatile -- but less relative to the benchmark when the market is rising on low volatility. That said, low volatility uptrends are often an excellent environment for absolute gains anyway and you will naturally participate in such a market because mean-reversion has zero market timing associated with it. That is, sometimes you will just track rather than outperform a low-volatility uptrend.... and that is a good thing.
to expand video on screen, click the '4 expanding arrows' icon in the bottom right corner of the video screen
Nov 04, 2019
in Mean Reversion
A video to demonstrate mean-regression on ETFreplay.com and some concepts on trading -- for example, many small gains cumulatively add up over time when you buy at wholesale and sell at retail prices.
to expand video on screen, click the '4 expanding arrows' icon in the bottom right corner of the video screen
Aug 27, 2019
in Mean Reversion, Video
A video to demonstrate mean-regression on ETFreplay.com and some concepts related specifically to ETF mean-regression.
to expand video on screen, click the '4 expanding arrows' icon in the bottom right corner of the video screen
Jul 09, 2019
in Backtest
Maintaining a well diversified portfolio is a time-tested way to protect against going all-in on what turns out to be a terrible investment. Diversification can also be employed at the strategy level for the same reason. An example of this is the core-satellite framework, where a rebalanced core portfolio is mixed with different strategies that focus on Relative Strength and Moving Average trend following etc.
It is also possible to diversify across different versions of a single strategy, to reduce the risk of parameter choice misfortune. For example, rather than relying solely on 12-month returns, for instance, the backtest below equal weights 4 variants of the same model: a 6-month version, 8-month, 10-month and one using 12-month returns all on the same ETFs: EFA, IEF and VTI (the constituents of BNCH).
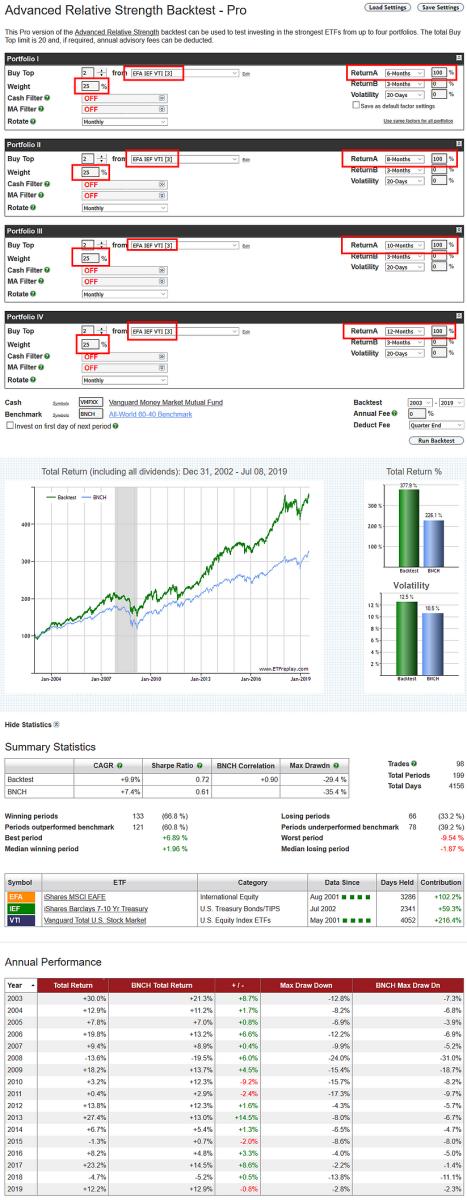
click image for full size version
Just as a well diversified portfolio means that at least some part of it will always be a drag, a composite made up of different model variants will always underperform the best version of the strategy....but it also avoids being exclusively in the worst.