Dec 22, 2015
in Backtest
In one of the best poker books ever written The Theory Of Poker, the author makes a point quite relevant to investing. He writes,
“Beginning poker players sometimes ask, ‘What do you do in this particular situation?’”
The problem is that it is simply the wrong question and indicates overly-simplistic mode of thought. The right question is:
“What do you consider in this particular situation before determining what to do?”
Likewise, the term ‘backtest’ is sometimes viewed critically by those who are beginners. Some make simplistic assumption that just by applying a longer timeframe to a given backtest then validates a strategy and that therefore they can just follow a simple model and don’t have to burden themselves anymore with any critical thinking.
But ETF backtesting isn’t anything more (or less) than information, and in the investment business, information is research. Research is what leads you to make informed decisions. Often times you run backtests that seem to conflict with each other in terms of what to do at a given point in time. A quarterly updating backtest with a 12-month lookback might have good results and indicates to hold on until Dec 31 while a monthly backtest with a 3-month lookback might be indicating a switch is called for immediately. Some argue that whichever one has a higher return over the longest timeframe available must be correct. But frankly, your strategy backtested to the year 1900 might not be nearly as relevant as you think (see Intro to Regime Change ETF Backtesting). It may even be an awful strategy for the present-day environment.
At the end of the day it is sometimes going to be a judgment call based on the weight of the evidence and the conclusions you reach based on your overall research/information.
No matter whether you stand pat and do nothing or make some trades due to perceived increased risk, you might end up wrong in the short-run. This is why you focus on the decision-making process and not short-term results because any single decision can lead to a poor result. But performance over time is the culmination of many decisions.
Some might say to this…. ‘well I don’t want to play’ and I do have the choice to ‘just buy index funds.’ But ask anyone maintaining a buy and hold global portfolio how those ‘just buy index funds’ portfolios have done? They are loaded in international stocks and emerging markets and have portions allocated to gold and other commodities. Have you seen how poorly these segments have done? Moreover, do you think the S&P 500 is immune to similar bouts of very poor relative performance? Think again.
The point is that any judgment you make can be right or wrong, so don’t think anyone is removed from the process just because they buy index funds. They aren’t. You didn’t see buy & hold investors do much marketing in 2001-02 during a bear market. Nor in 2008-09. Buy and hold global advisors of today can’t market their returns because they have losses, not returns.
Summary: Focus on what to ‘consider’ and then make an informed decision. Good investors know how to control their drawdowns while still exposing themselves on the long side as a general framework. Backtesting is very much a part of this broader decision-making process because be it buy hold portfolio allocation backtesting or tactical backtesting, backtesting is simply about research.
Sep 28, 2015
in Relative Strength
Approaching month / quarter end, none of the major asset classes are showing any strength relative to cash.
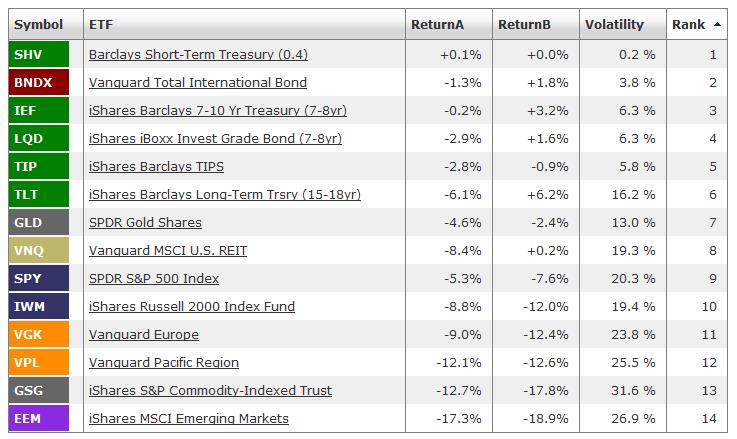
The only market with any shorter-term upside momentum (see Return B above) are U.S. Long Term Treasuries. For the bull case, TLT needs to hold above the June low. Failure to do so would turn the trend down.
Despite the recent sell-off in U.S. equities, the relative weakness of foreign stocks continues. We have been monitoring this for potential trend change, but there are no signs of that yet.
The usual caveats:
- This is a short example of the type of the analysis we do to assess market structure in order to take tactical positions. We favor diversification at the strategy level and any tactical positions form just a part of the whole.
- Probabilities play out in the long run, in the short term anything can happen.
- In no way should any of the above be considered investment advice.
Apr 12, 2015
in Mutual Funds
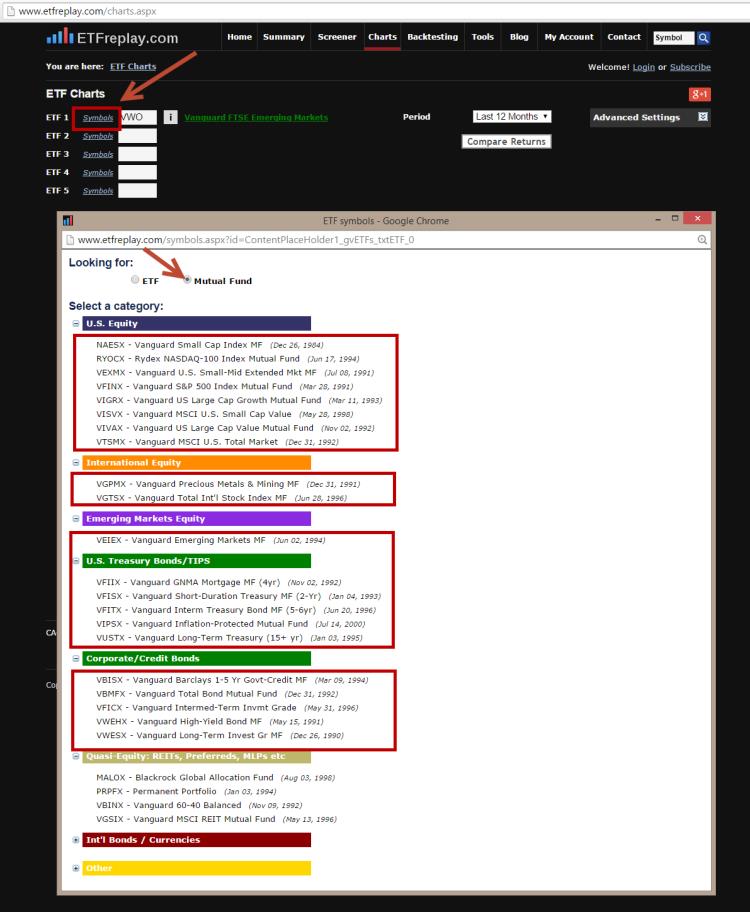
Q. "I have seen a number of articles that suggest that the author has used ETFreplay to backtest mutual funds. This is something I would like to do but I don't see where this can be done on the website. Can you help?"
A. Index mutual funds have been available to be tested just like ETF's on ETFreplay.com. We added these a few years ago to fill in spots that don't have 10-15 years of data available, like many ETF's do. You can find a list of index mutual funds by clicking on the 'Symbols' link where you enter tickers on various pages on ETFreplay.com. In addition, you can build portfolio lists using mutual funds symbols just like you would ETFs.
Mar 10, 2015
in Regime Change
Q. What is regime change?
Regime change in financial markets terms means that there is a shift in a basic financial relationship that has governed a backtest periods results. Some examples might be an inflationary regime changing to a disinflationary era, reflected in how long-term treasury bonds behave. Or it might be a period of sustained high equity market volatility changing to a more narrow range market. Or a rising US Dollar vs a US dollar bear market. Rising price of oil vs declining etc....
Q. Why is understanding what regime you are in important?
Models and backtests are good at identifying relationships and how to profit from those relationships. But standard backtesting is only good if that financial relationship you are backtesting actually stays in-tact. Relationships develop, exist for a period of time --- often lengthy -- and then they can change.
Recall that the rules of financial markets are not like the rules of other areas of observation like in science. The temperature at which water freezes is the same across time. However, the financial markets are different and need to be thought about differently. You cannot be sure that a given financial law will continue into the future. Water doesn't learn from its freezing in the past and adapt -- but investors do.
Thus, regime change is one of the main problems with many articles you see written that study only very long periods of time. You get caught thinking something is true over the long-run and so -- since you are a long-term investor after all -- you don't care about a 3-7 year period of poor performance.
But there is a key problem with that, what if the underlying regime assumption has been mined and through that long-term analysis papers were written about this financial 'law' that exists. But we know that the thing you are counting on is NOT a law of nature, it is just a financial relationship. If you are wrong in your belief system, how much drawdown (or lost performance) will it take you before you figure out your previous thinking was simply flawed in terms of a reasonable time frame of performance analysis (3-7 years) ?
Q. How do you identify regime change?
This takes ongoing research. This takes ongoing thinking. This takes work. You can and should think about very long-term backtests too -- we are not advising taking only a short-term approach --- but then you should also put time and effort into intermediate-term backtesting to help determine whether the model you are relying upon is acting correctly. Balance the long-term backtests with shorter/intermediate term backtests. There is no way to know exactly how relationships will hold/change in the future --- but you can monitor them in ongoing fashion. You don't have to ride a relationship down into oblivion.
New ETFreplay Backtesting Module: "Regime Relative Strength"
This new module uses some existing methods that have been on ETFreplay.com for years --- but it now combines them into a single process. Before, you had to build this using component modules and then assemble and enter the information as an imported backtest. Now we have automated portions to take more of the monotonous sludgework out and give you more time to do what you should be doing with your time, doing research and thinking about the relationships to test -- not the mechanics of how to make a backtest work and the associated de-bugging.
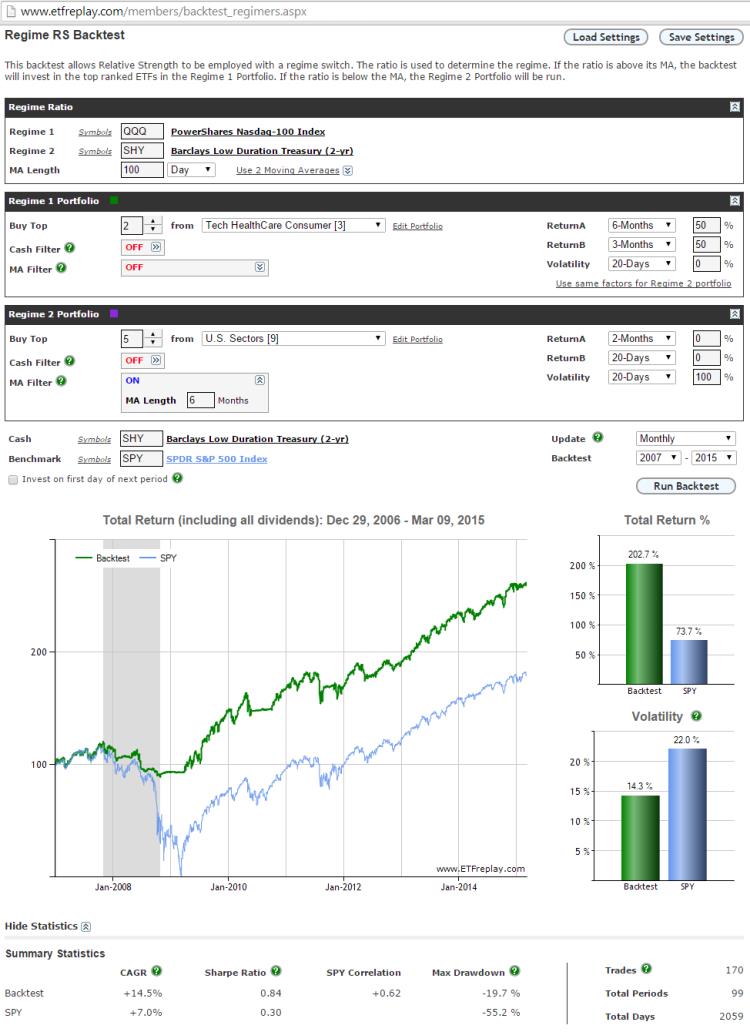
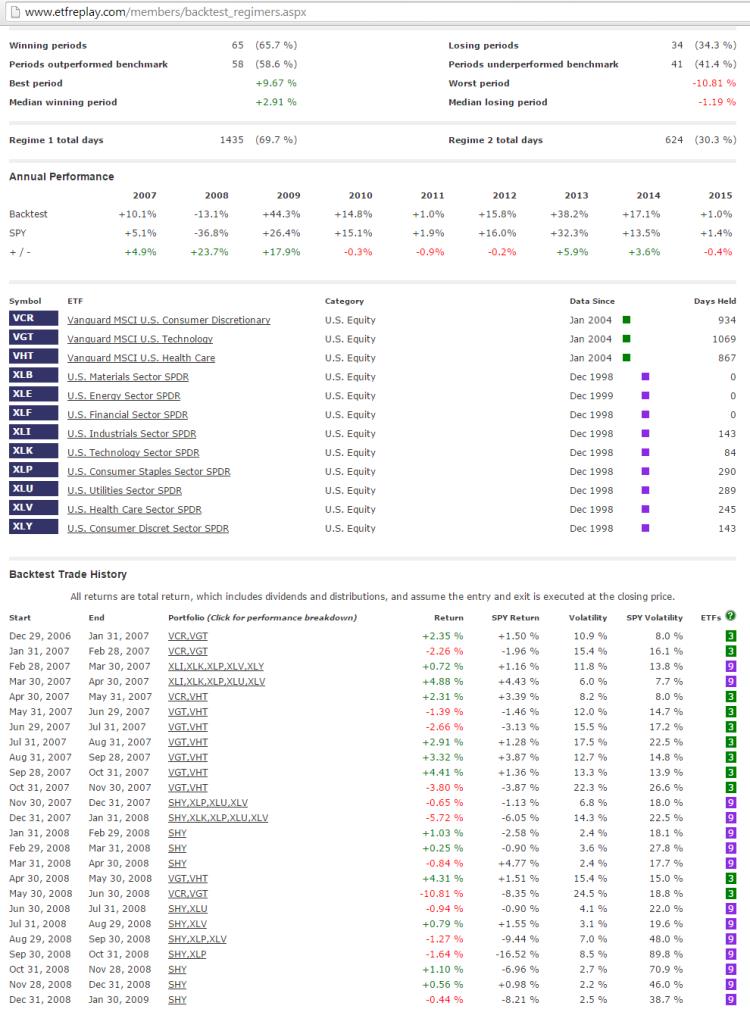
Think of this as a multi-step process rolled into a single backtest. First, you come up with a rule of how to define Regime 1 vs Regime 2. Once the regime is determined, you line up a backtest strategy for that regime. When the regime switches, you associate a 2nd strategy for that regime. You are always in one regime or the other, there is no grey area -- (backtests need to be specific in the details).
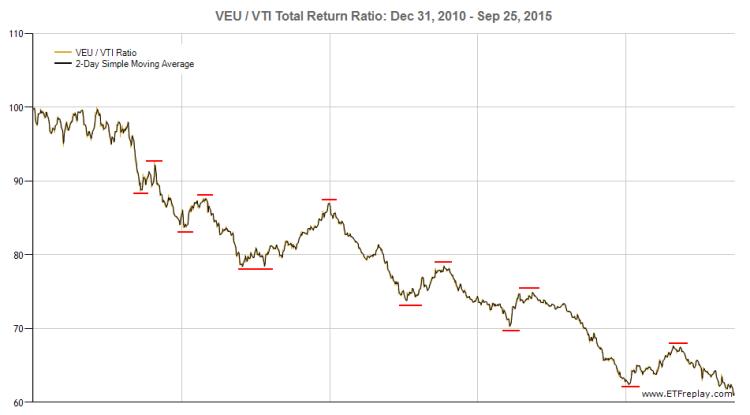
We have defined the 'rule' in this case based on the concept of the Ratio Moving Average. Recall that if you are judging many ETFs (more than 2) against each other, you should use a multi-factor model. But if you are just looking at 2 ETFs, one vs the other, then you may want to just use the total return ratio of the 2 and define rules that way.
Once you have defined what constitutes Regime 1 or Regime 2, you can then set up a strategy for each regime.
Example:
Regime 1 Rule: When QQQ / SHY is trending up (above its 100-day MA because QQQ is stronger)
Regime 1 Portfolio: Own the top 2 performing basic NASDAQ Sectors
Regime 2 Rule: All Other Times (i.e. QQQ / SHY is trending down because QQQ is weaker)
Regime 2 Portfolio: Reduce drawdown risk but maintain equity exposure by owning lower vol ETFs.
This is a very simple example. You can of course add filters such as cash or moving average filters just like the regular backtesting applications elsewhere on ETFreplay.
Update: If you want to run a backtest that switches Relative Strength strategy based on whether or not QQQ alone is above / below its x-period MA, then you can use the ratio of QQQ / XZERO. ZERO is a constant (i.e. zero return), so an MA of the ratio QQQ / XZERO is the same as a moving average of QQQ itself. See 'Using SPY as a regime switch'
Dec 11, 2014
in Relative Strength
User Question:
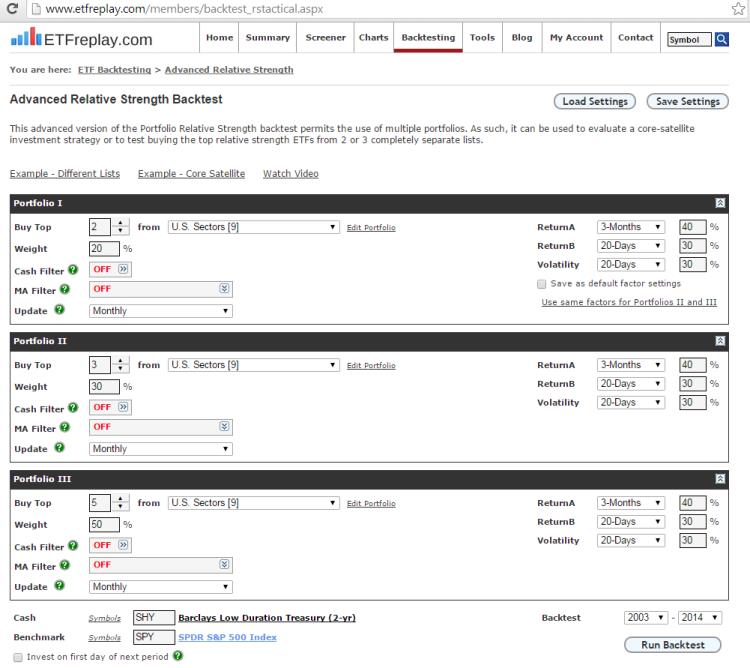
I run a portfolio relative strength backtest with 5 ETF but all are assigned an equal weight of 20%. How can I assign different weights to the ranked ETFs? Example: Top 5 Weighted as 30%, 30%, 20%, 10%, 10% respectively."
Answer:
For this you would use the Advanced Relative Strength Backtest (subscriber link).
By layering the strategies using different numbers of selections while at the same time using the same ETF list, you can create weightings based on Rank.
Note that the top two ranked securities in this portfolio list would each receive 10% from portfolio I, 10% from portfolio II and 10% from portfolio III. The backtest report combines weights and it becomes simply 30% for each of the two top ranked ETFs. Similarly, the 3rd ranked ETF received 10% from Portfolio II and 10% from portfolio III; making 20% in total. The 4th and 5th ranked ETFs are allocated 10% each by portfolio III.
Dive into the backtest report to see all the breakdown of sub-periods and the weightings of each ETF and its contribution to return for that period.