Jan 19, 2011
in Down Days
As we enter a period of higher volatility after a long sustained move up in equities, we ran some statistics on 25 of the largest ETFs in the world to see how they performed on a relative basis when the S&P drops X%.
In this case, we chose to use 10 S&P pts, which works out to about 0.75%. How did various ETFs perform on just those particular down days?
Since the March 2009 low, the S&P 500 has dropped in excess of -0.75% eighty-five times. The average S&P 500 loss for these 85 days was -1.68%. Here are some results for 25 ETFs which summarize their performance on just those 85 days:
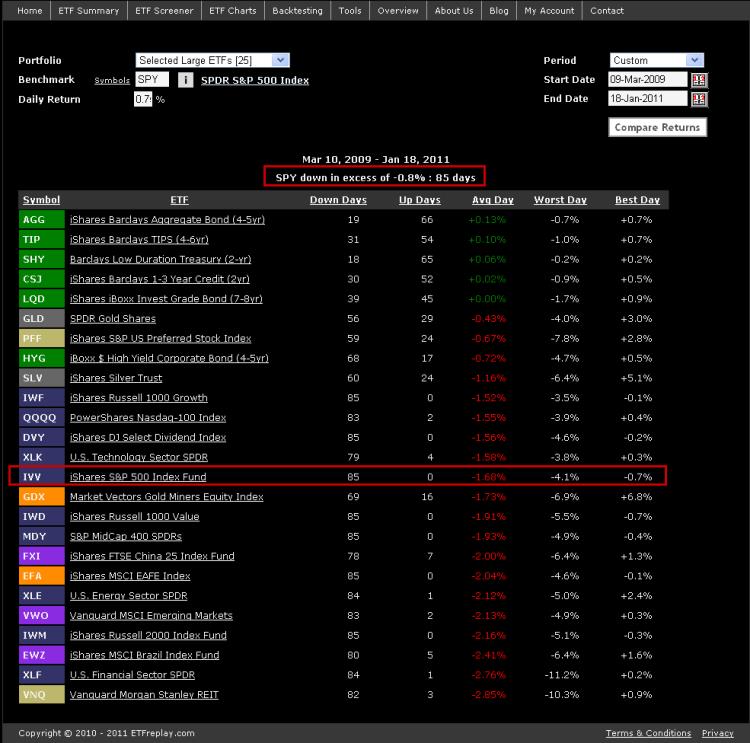
You can see that among the worst for this period were REITs (VNQ), U.S. financials (XLF), Brazil (EWZ) and U.S. Small Cap Stocks (IWM). It makes sense, these are all higher volatility market segments. Technology stands out for doing a bit better than you might have expected.
Bond indexes have low standard deviation and low correlation to U.S. stocks so they generally rose --- but as you can see, very modestly and not nearly enough to offset much of the loss in equities.
Gold, Preferred Stocks and High-Yield Bonds all show losses on average -- but more modest losses given their lower correlations with stocks. Dividend ETFs (DVY, SDY) were down on all 85 days (85 for 85) -- which isn't a big surprise. The dividend indexes didn't do particularly well on a relative basis however and lost almost as much as the S&P 500.
Now let's look at todays (Jan 19th) drop in various markets:
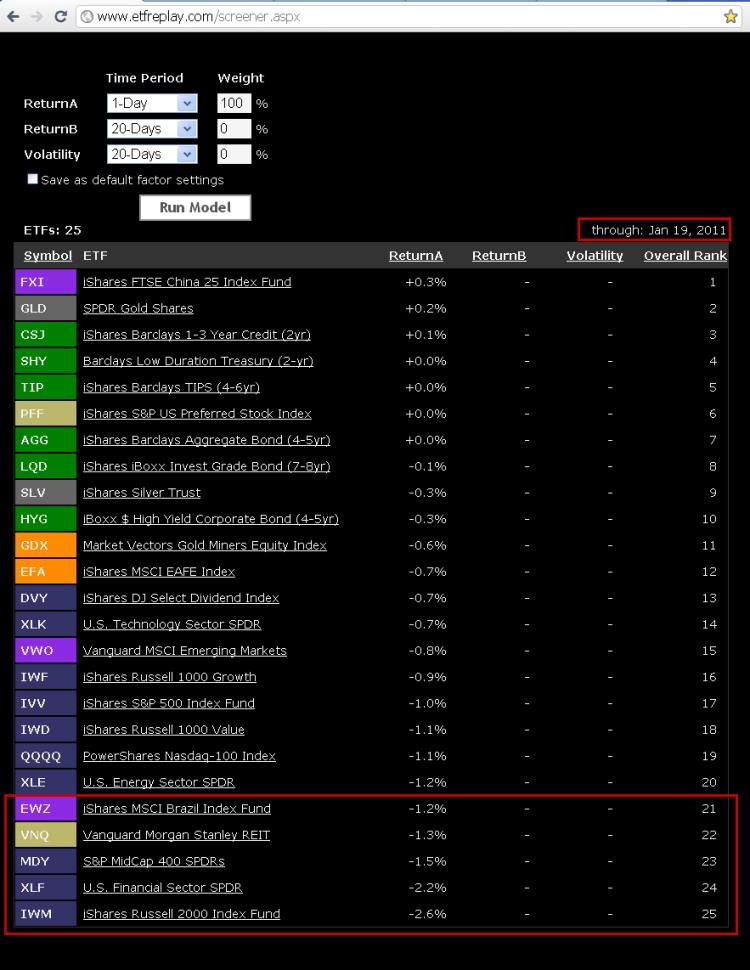
At the bottom of the list of todays (1-Day) performance are the exact same ETFs as the first list.
A couple of ideas here:
1) If you think you are going to get any diversification benefit from owning REITs in a down S&P market, we would tend to doubt that.
2) Bonds don't provide much absolute protection in S&P 500 down days --- but they do obviously serve their purpose of stabilizing a portfolio.
3) Dividend stocks may offer only modest protection in down markets.
Note that the China ETF (FXI) went up slightly today -- so there is the outlier of the day (of course no conclusion to draw here off 1 day of data).
Summary: it helps to study volatility and down markets. Todays performance was quite consistent with the same relative stats of the last two years.
Update: The first screenshot is now available in application form -- because it runs by auto-loading your user-created portfolios, it needs a login to access the page: ETFreplay Tools Page
Jan 11, 2011
in Relative Strength, Moving Average
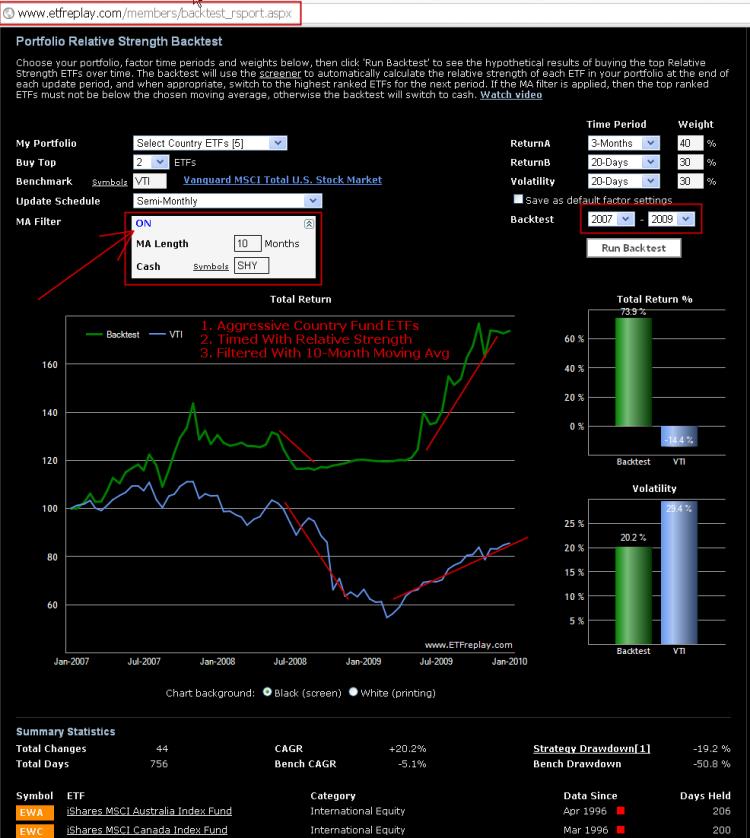
We have added an optional moving average (MA) filter feature to the RS backtest app. With the recently expanded date start and stop functionality, the applications continue to get more versatile.
Combining a long-term moving average within the construct of relative strength has been highly requested and we wanted to discuss one idea when considering whether to use it (note that you can just leave it set to ‘off’ as well).
If you build a relative strength list of say 10 ETFs and you are choosing the top 2, you could protect your portfolio by including 2 bond funds. You don’t need a moving average filter because the bond funds will naturally be the ones with the relative strength when equity markets are dropping. This method actually can get more interesting because you can make better use of more type of ETFs. Rather than just use cash-like bond funds, you might want to extend the potential holdings to an intermediate bond fund like IEF (7-8 year duration) or others. You don't HAVE to restrict yourself to just stocks and cash.
Another way to test is by using a moving average. If you do it this way, then you will inherently be out of ETFs as they go into extended downtrends. You don’t have to proportionally keep X number of bond funds in your list if you do it this way.
But a lot of indexes can go above or below a long-term moving average and still not really be a source of market leadership and enhance your return. Moreover, you may save a lot of money between the time ETFs lose relative strength and the time they actually cross below the moving average. For these reasons, we believe adding relative strength to a MA strategy will generally be more robust. Adding MA to a RS strategy is optional -- and you may find works better or worse than your existing method. Continuous testing leads to better decisions.
Dec 28, 2010
We have noticed that there still seems to be a fair bit of misunderstanding among those new to ETFs. While the structure of ETF's is different than you may be used to -- it is really not that complex.
Ignoring leveraged and inverse ETFs --- the vast majority of ETF assets are plain vanilla index funds --- they are not derivatives.
Some people think that since ETFs are only representing shares -- and that they aren't actually the underlying securities--- this therefore makes an ETF a derivative. But this is simply not true. The ETF holds the actual shares it represents just as when you buy a mutual fund, you don't get the shares delievered to you --- you get mutual fund shares that represent the underlying securities. Clearly everyone should understand that mutual funds are not derivatives. They are classified by the S.E.C. as investment funds --- which is how the S.E.C. categorizes ETF's as well.
In fact, you could argue ETFs are less of a derivative than a mutual fund as in the ETF process, actual shares are passed for any creation/redemption. This is not true when buying a mutual fund. If you send $2,000,000 to a mutual fund, they create shares for your purchase -- but they do not necessarily buy anything with that money --- it could just sit in cash, it depends on the decision of the portfolio managers. During this process, no exchange is necessarily involved. You can send your money directly to a mutual fund company and no exchange would ever know the difference. There were some scandals on this topic in the early 2000's that you may remember regarding late-trading and manipulation --- this was only possible because there was little transparency of this off-exchange activity.
To better understand how simple this really is, below is an image of the basic mechanics. Note that in reality there are actually custodians, index information providers, authorized participants and market makers involved ---- but those are all peripheral considerations.
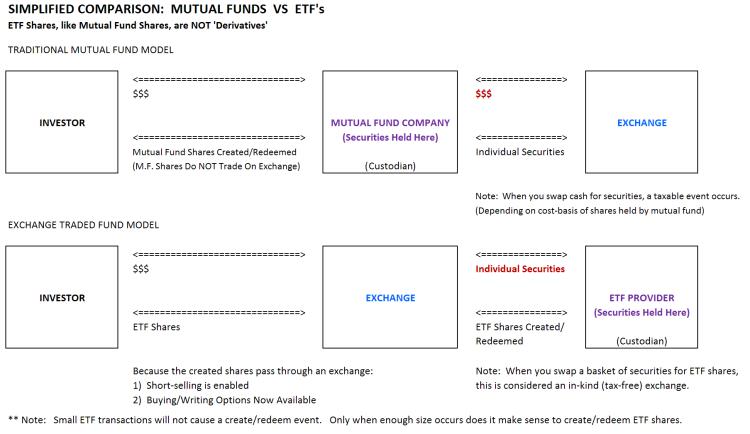
Note also that because the shares are created behind the scenes and the shares traded are on an exchange, this opens up a few new markets. Now you can sell ETFs short and/or you can trade options on these exchange products. Neither of these are possible when the creation occurs directly to the investor. Even if you never sell short or trade options, this activity is actually good for you --- as all this incremental trading volume created by options participants allows the ETF provider to cycle out lower-cost shares in the tax-free exchange between the exchange and the ETF provider. You can see in the diagram above how this is only possible because the exchange sits BETWEEN you and the fund provider.
Dec 14, 2010
in Screener
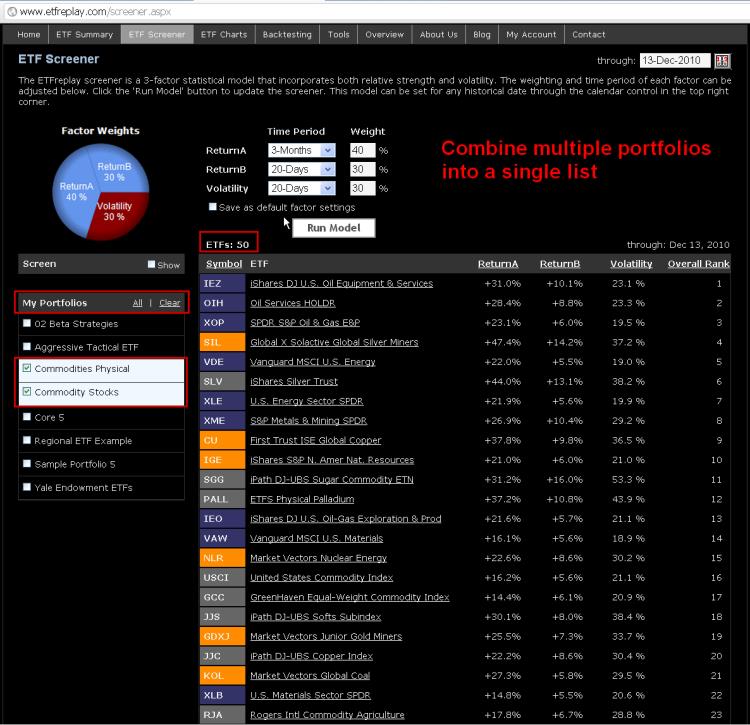
Screenshot of ability to combine multiple ETF portfolios into a single list on the ETF screener. This example takes a list of 25 commodity ETN's (tracking the underlying commodity) and combines this list with 25 commodity stock ETF's. You can combine as many lists as you would like and/or 'Select All.'
Dec 08, 2010
in Relative Strength
Some links to published research on various forms of relative strength concepts. The concept is over a century old. (I am not aware of any studies that involve ETFs directly -- let us know if you know of one).
Abstract from paper #1 above 'Time Series Momentum':
"We document significant "time series momentum" in equity index, currency, commodity, and bond futures for each of the 58 liquid instruments we consider. We find persistence in returns for 1 to 12 months that partially reverses over longer horizons, consistent with sentiment theories of initial under-reaction and delayed over-reaction. A diversified portfolio of time series momentum strategies across all asset classes delivers substantial abnormal returns with little exposure to standard asset pricing factors, and performs best during extreme markets. We show that the returns to time series momentum are closely linked to the trading activities of speculators and hedgers, where speculators appear to profit from it at the expense of hedgers."